Overview
Statistics
-
Tally Mark Charts, Bar Charts, Tables
-
Absolute and Relative Frequencies
-
Median, Mean, Mode, Range
-
Median, Mean, Mode, Range from a Frequency Table
-
Box Plots
-
Grouped Frequency
-
Line Graphs and Curve Graphs
Tally Mark Charts, Bar Charts, Tables
Video Tutorial
Key Aspects:
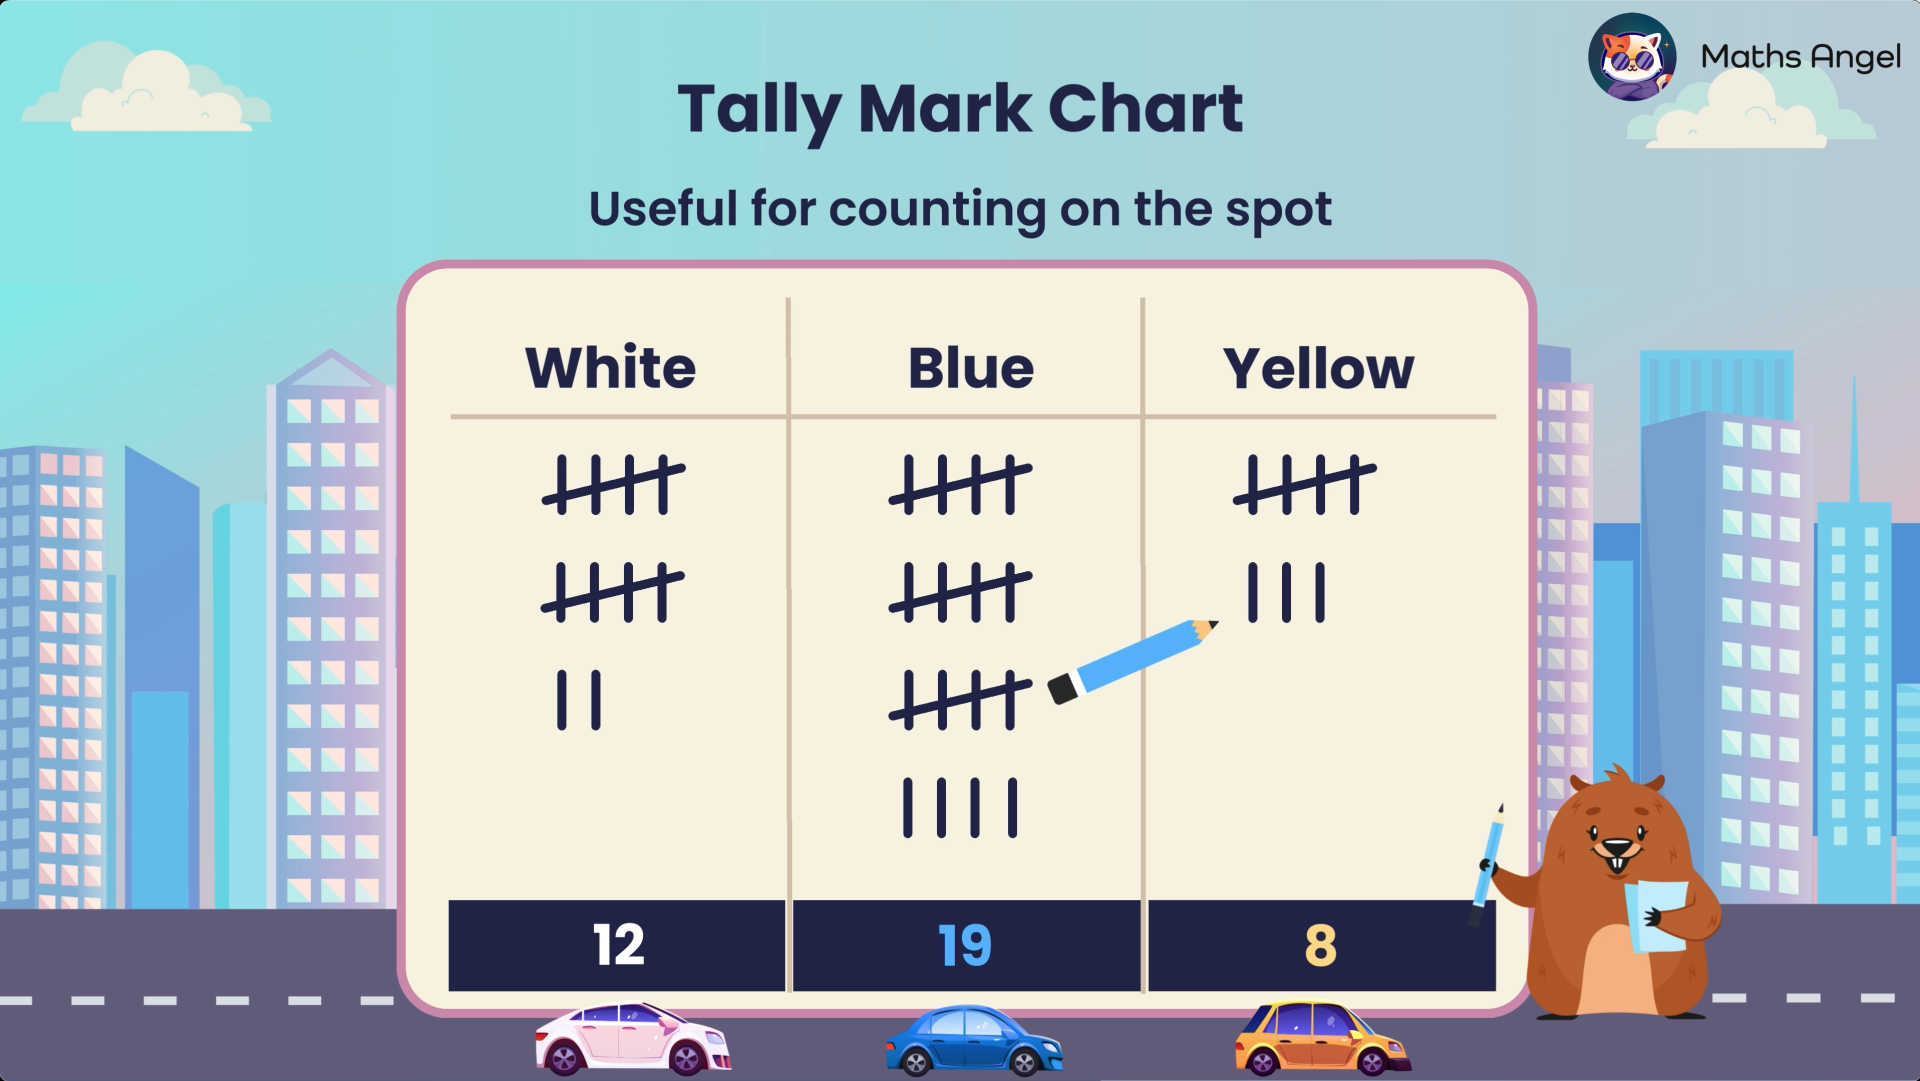
- Tally Mark Charts for efficient counting
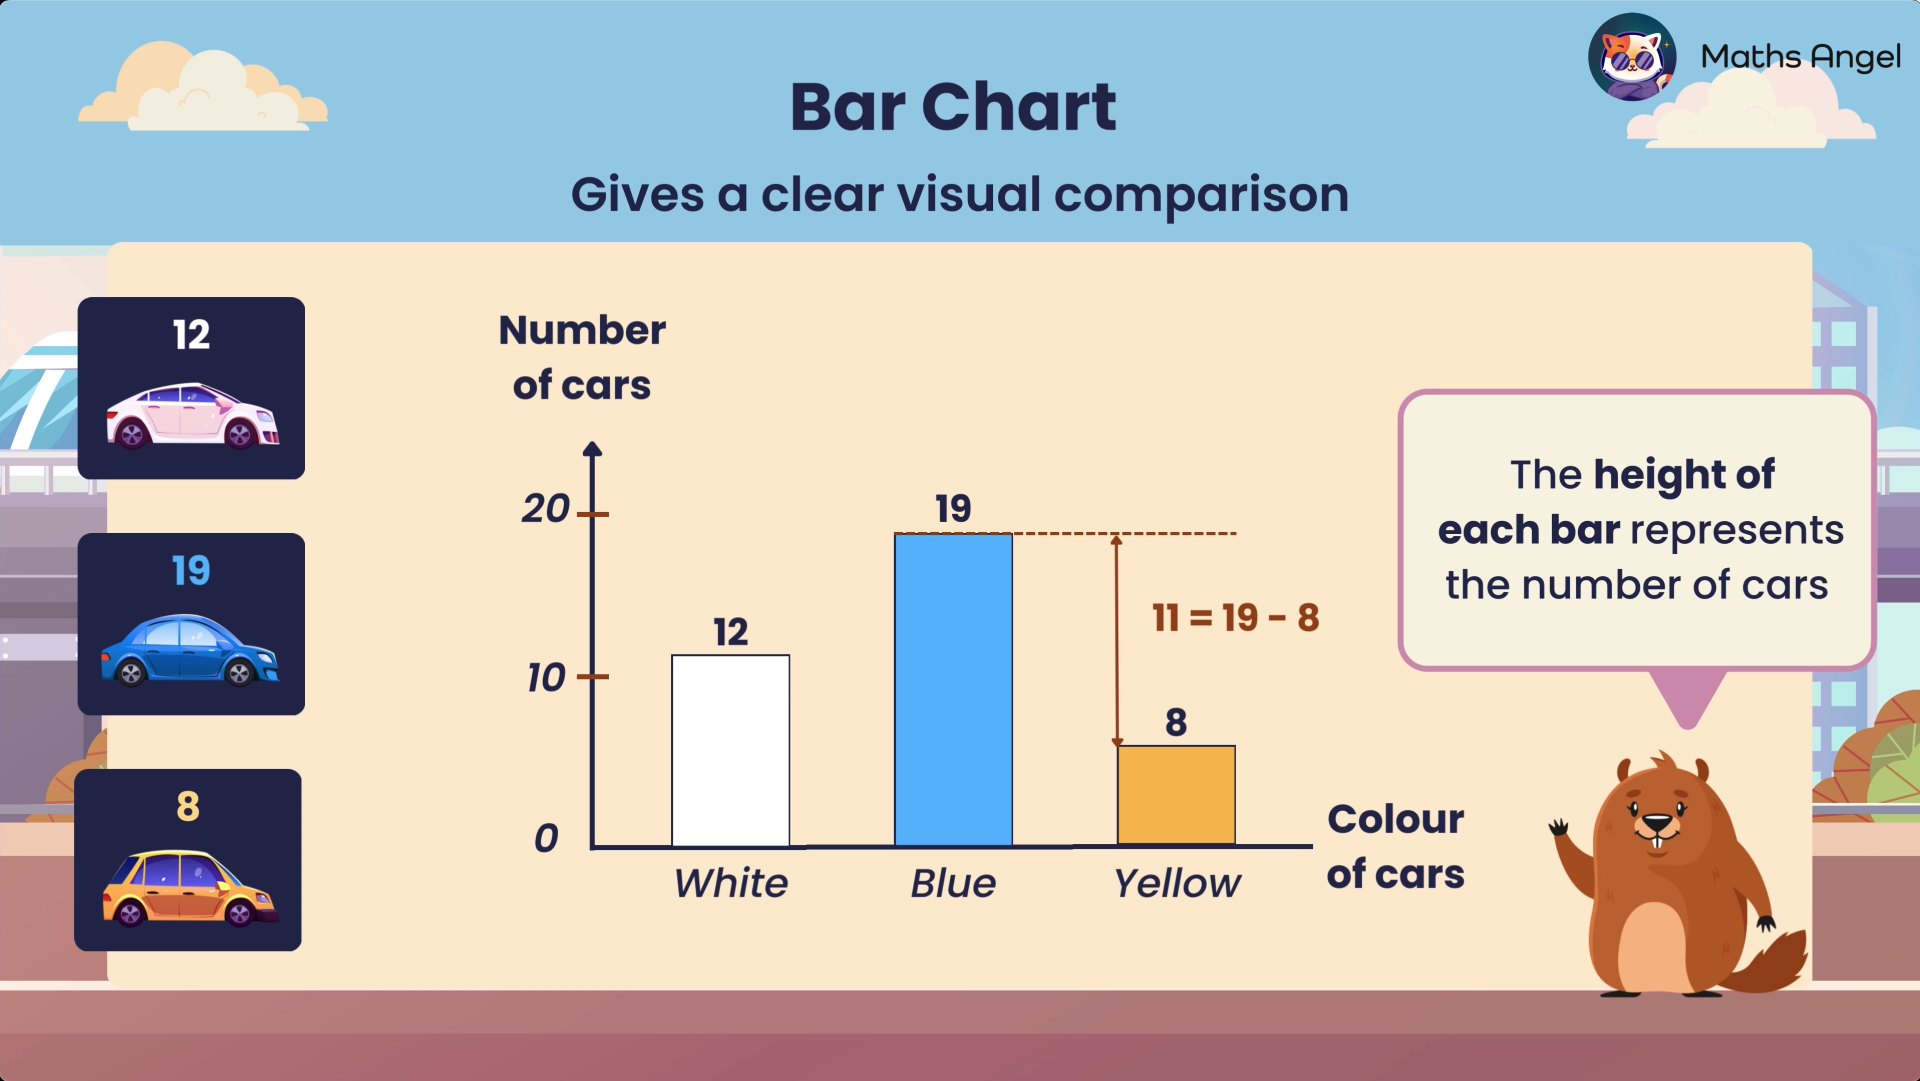
- Bar Charts for data presentation
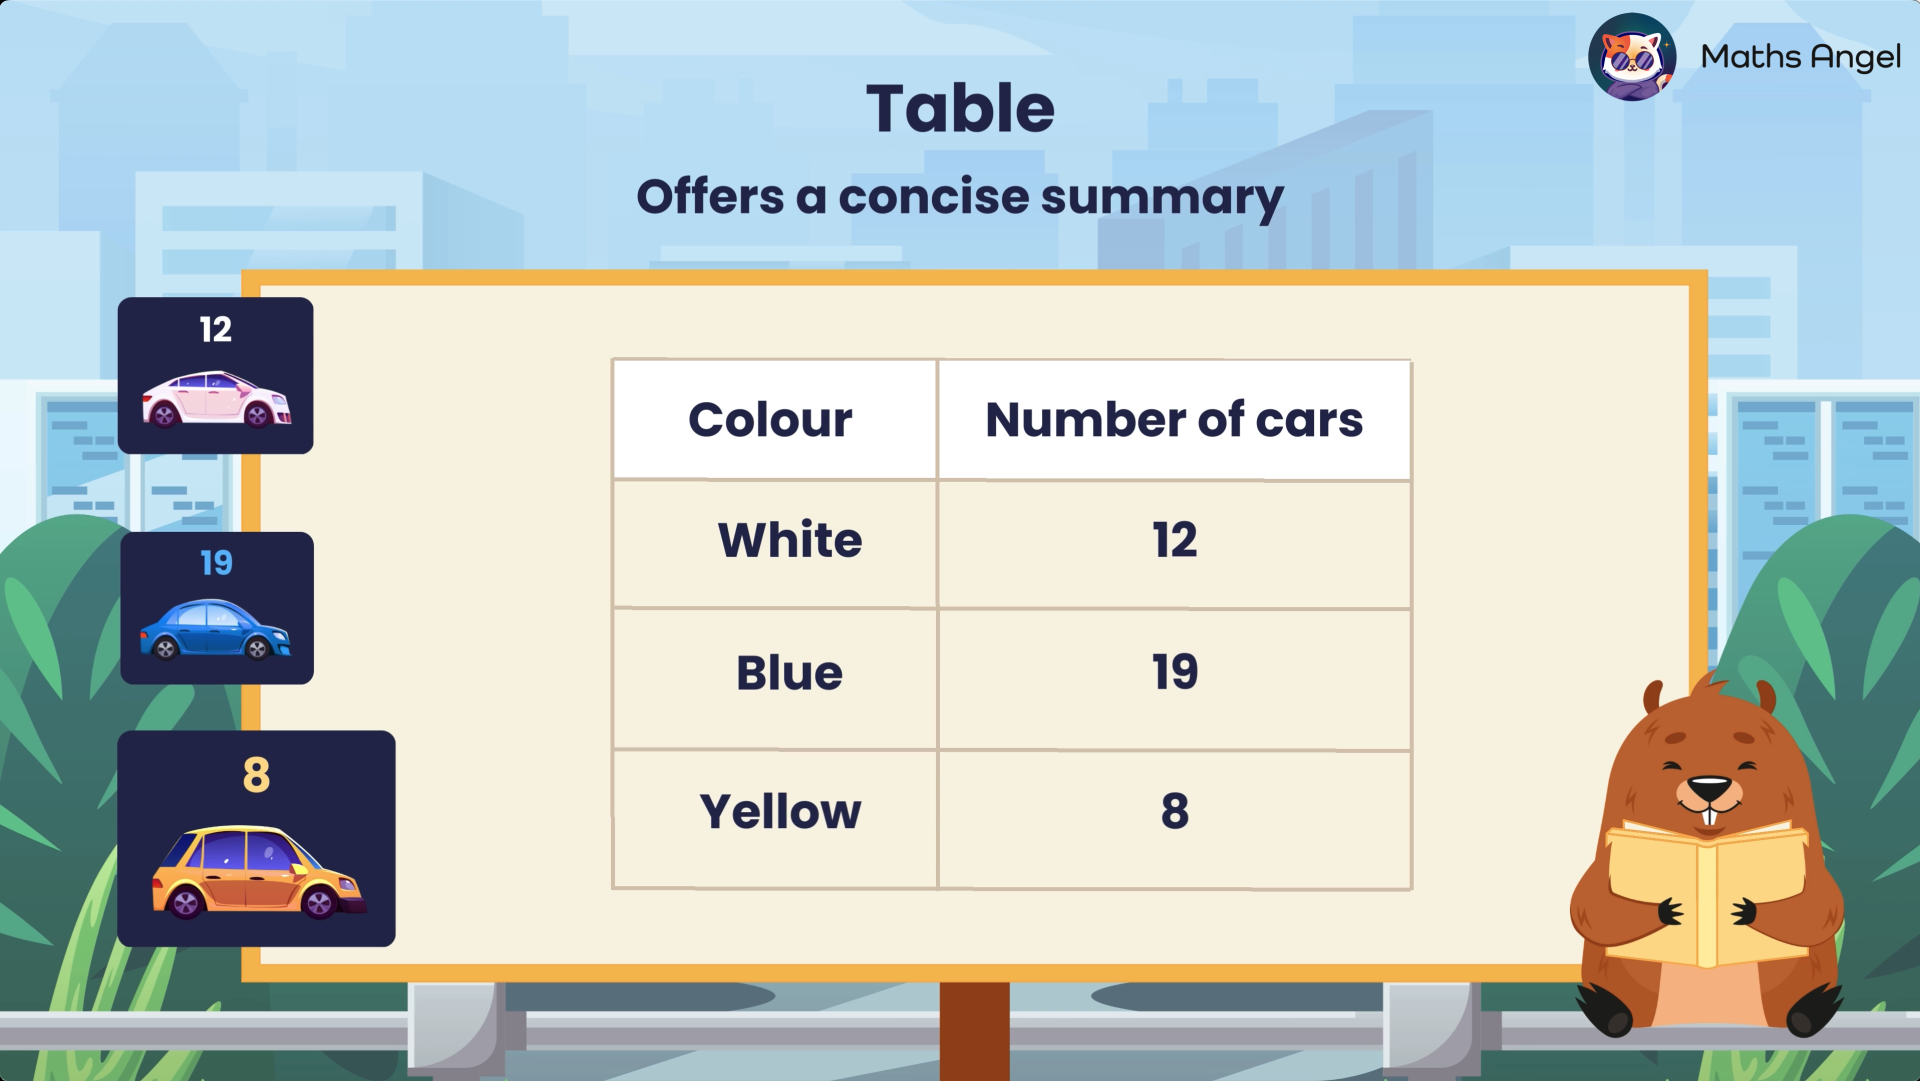
- Employing tables for a compact data summary
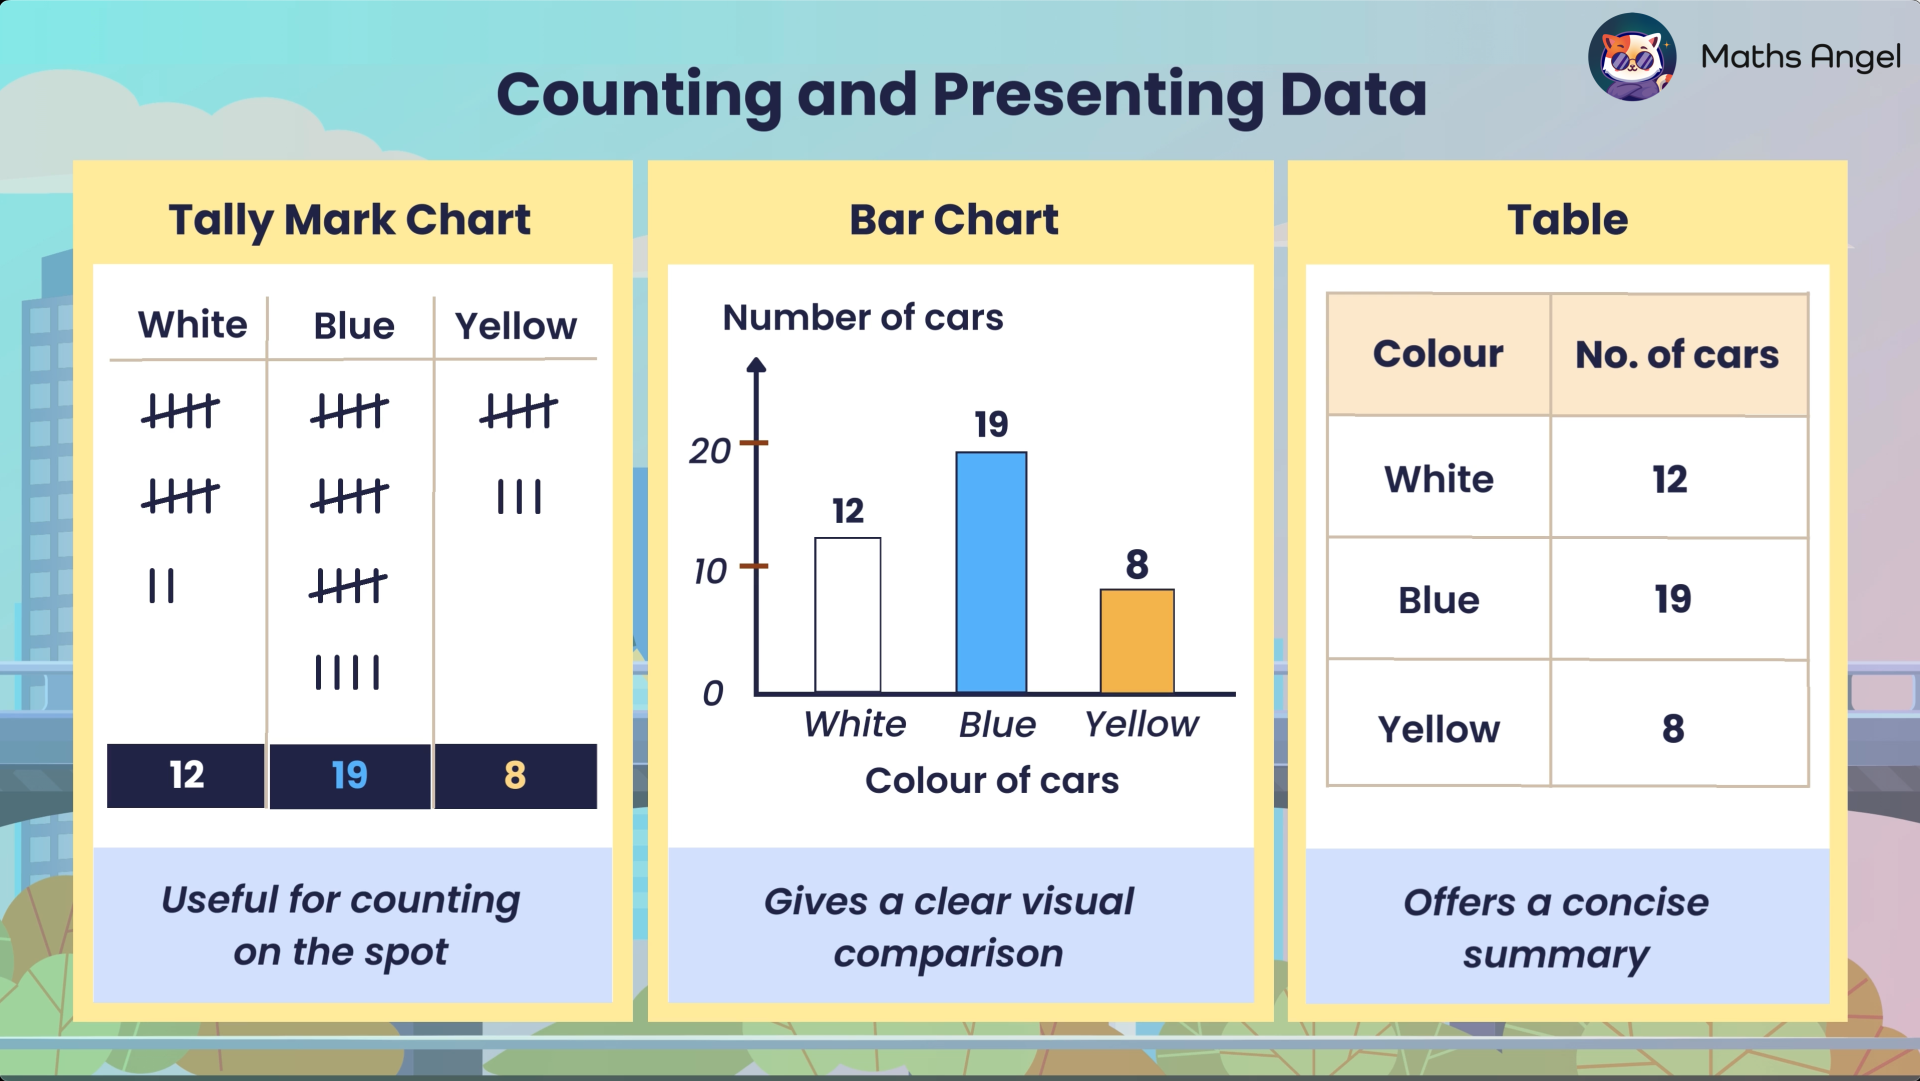
- Comparing different data presentation methods
Write your awesome label here.
Revision Cards
1) Tally Mark Chart

2) Bar Charts

3) Tables

4) Tally Marks, Tables, and Bar Charts

ChatCat - Your Personal AI Maths Tutor
Exercises
(No payment details needed)
