Overview
Statistics
-
Tally Mark Charts, Bar Charts, Tables
-
Absolute and Relative Frequencies
-
Median, Mean, Mode, Range
-
Median, Mean, Mode, Range from a Frequency Table
-
Box Plots
-
Grouped Frequency
-
Line Graphs and Curve Graphs
Line Graphs and Curve Graphs
Video Tutorial
Key Aspects:
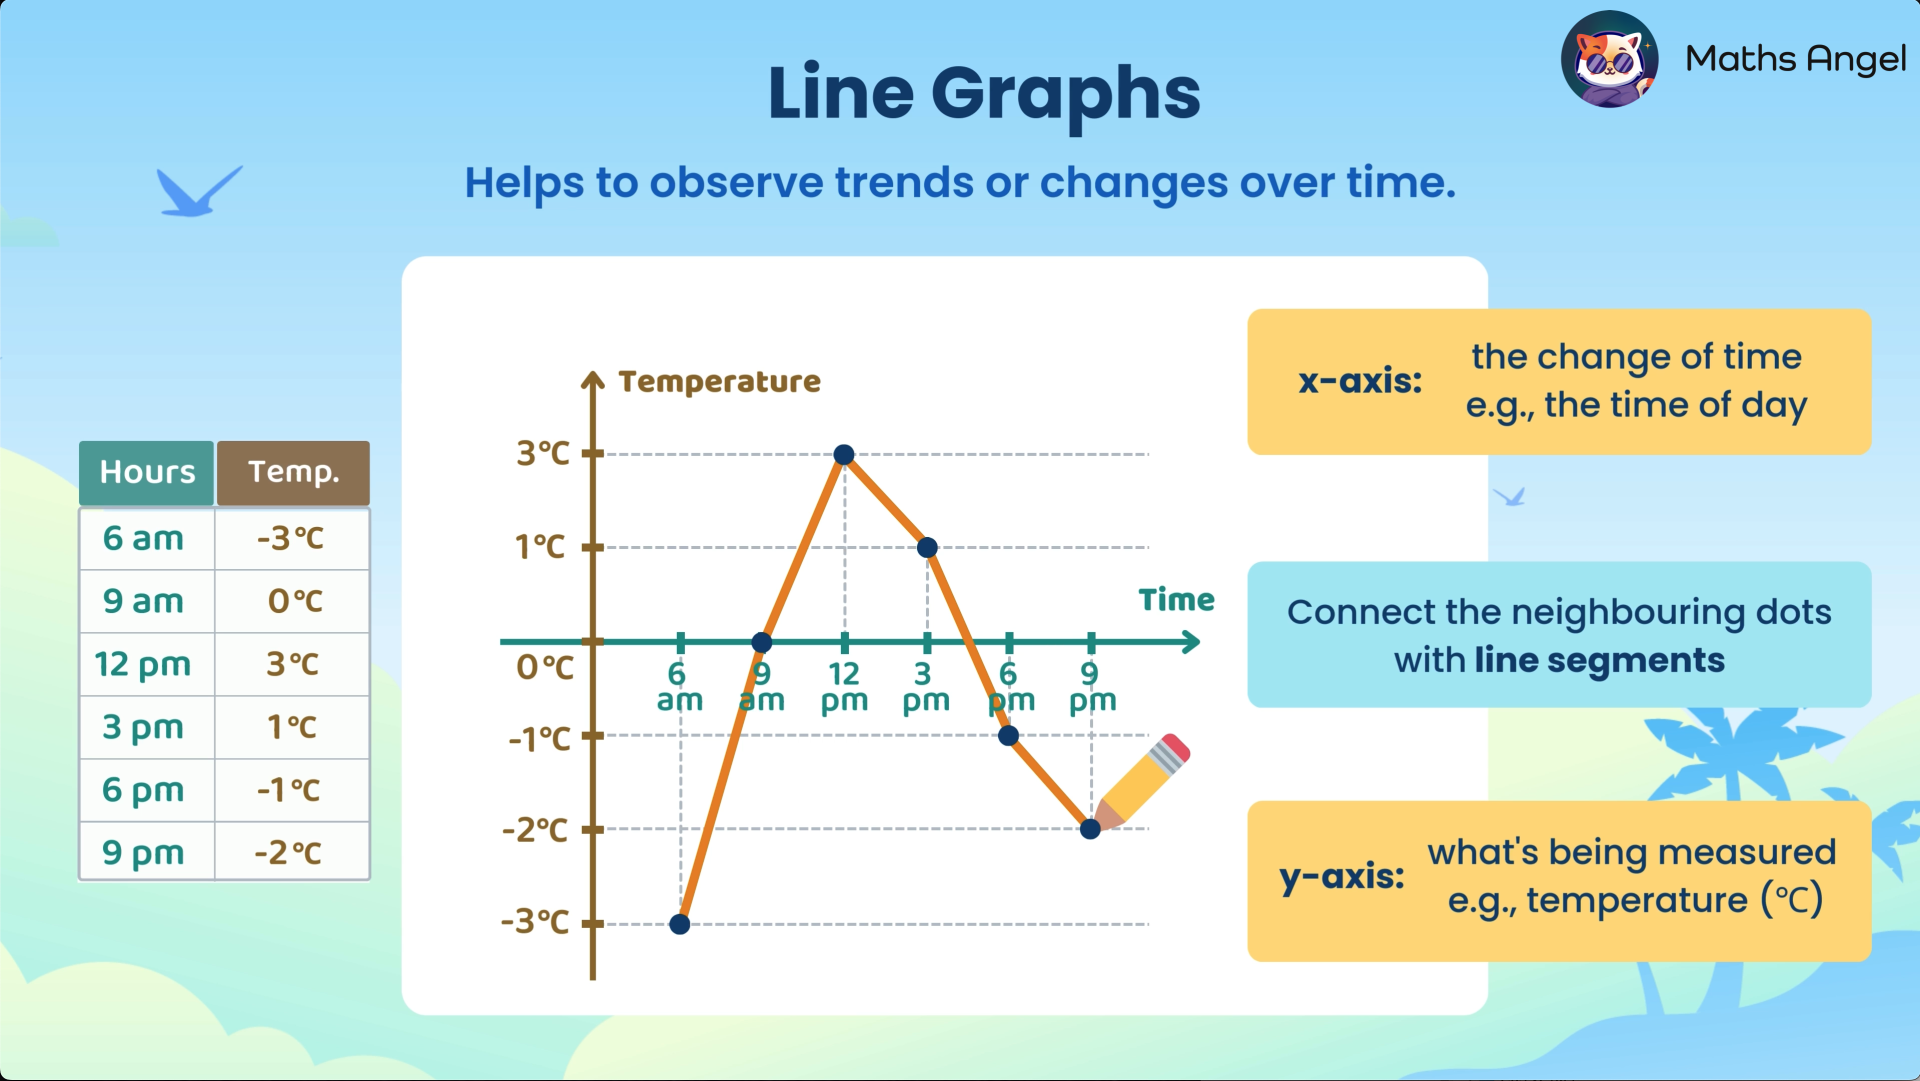
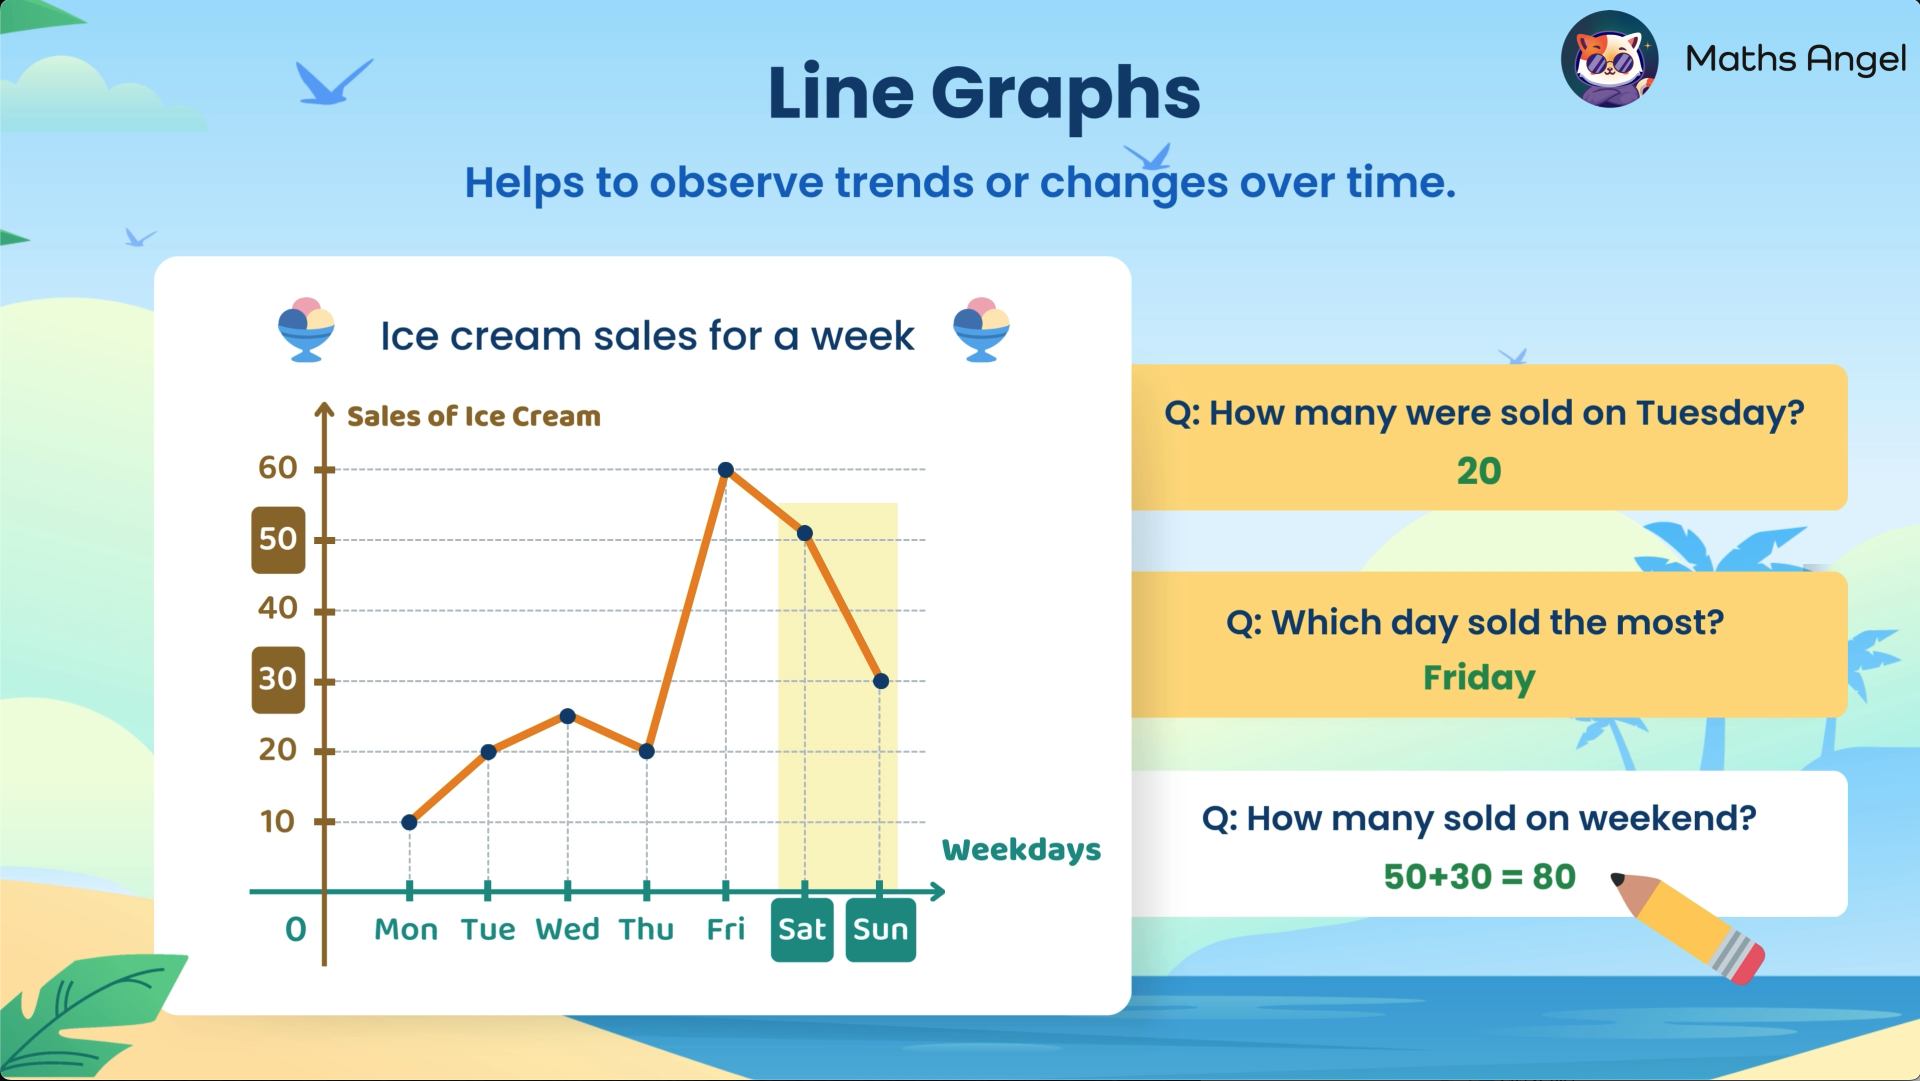
- Line graphs to represent and analyse data
- Line graphs for linear relationships
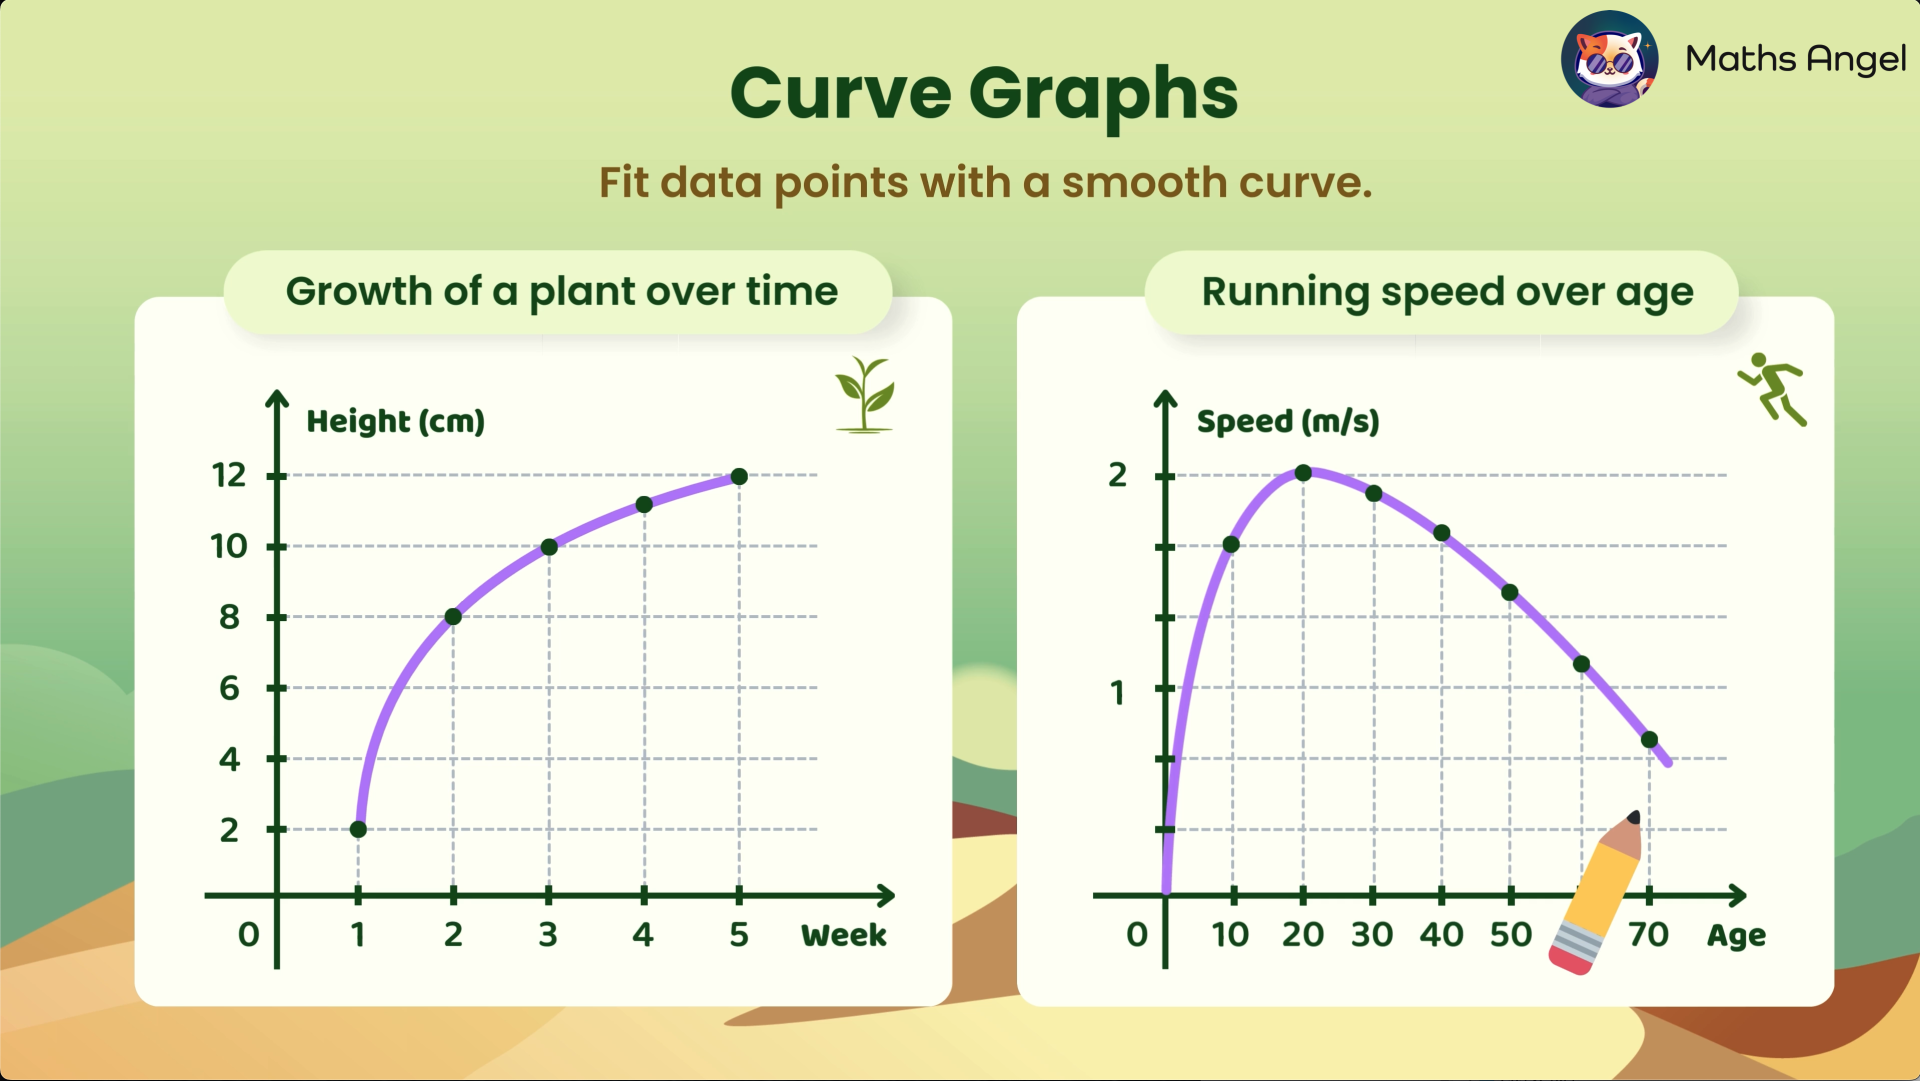
- Curve graphs for non-linear relationships
Write your awesome label here.
Revision Cards
1) Line Graph from a Data Table

2) Interpreting a Line Graph

3) Examples Where Curve Graphs Are More Appropriate

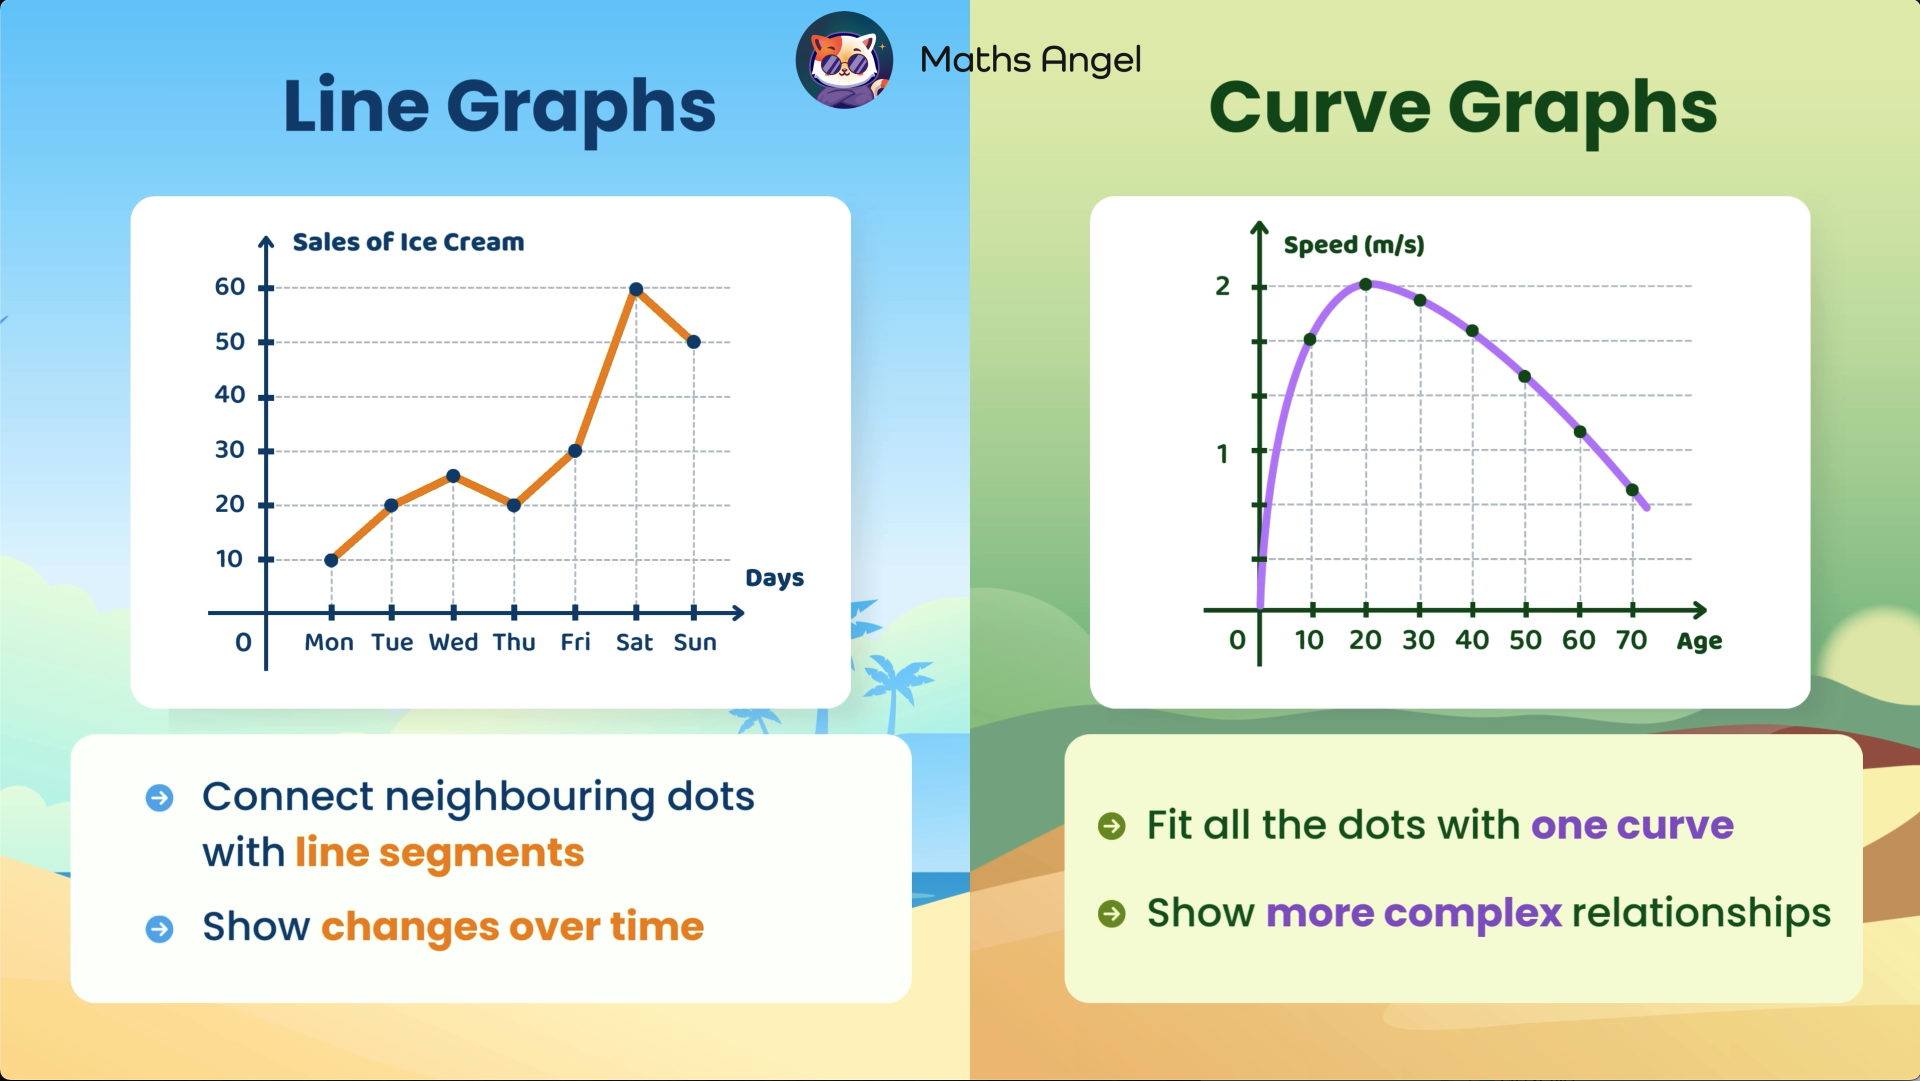
4) Line vs Curve Graphs

ChatCat - Your Personal AI Maths Tutor
Exercises
(No payment details needed)
