Overview
Statistics
-
Tally Mark Charts, Bar Charts, Tables
-
Absolute and Relative Frequencies
-
Median, Mean, Mode, Range
-
Median, Mean, Mode, Range from a Frequency Table
-
Box Plots
-
Grouped Frequency
-
Line Graphs and Curve Graphs
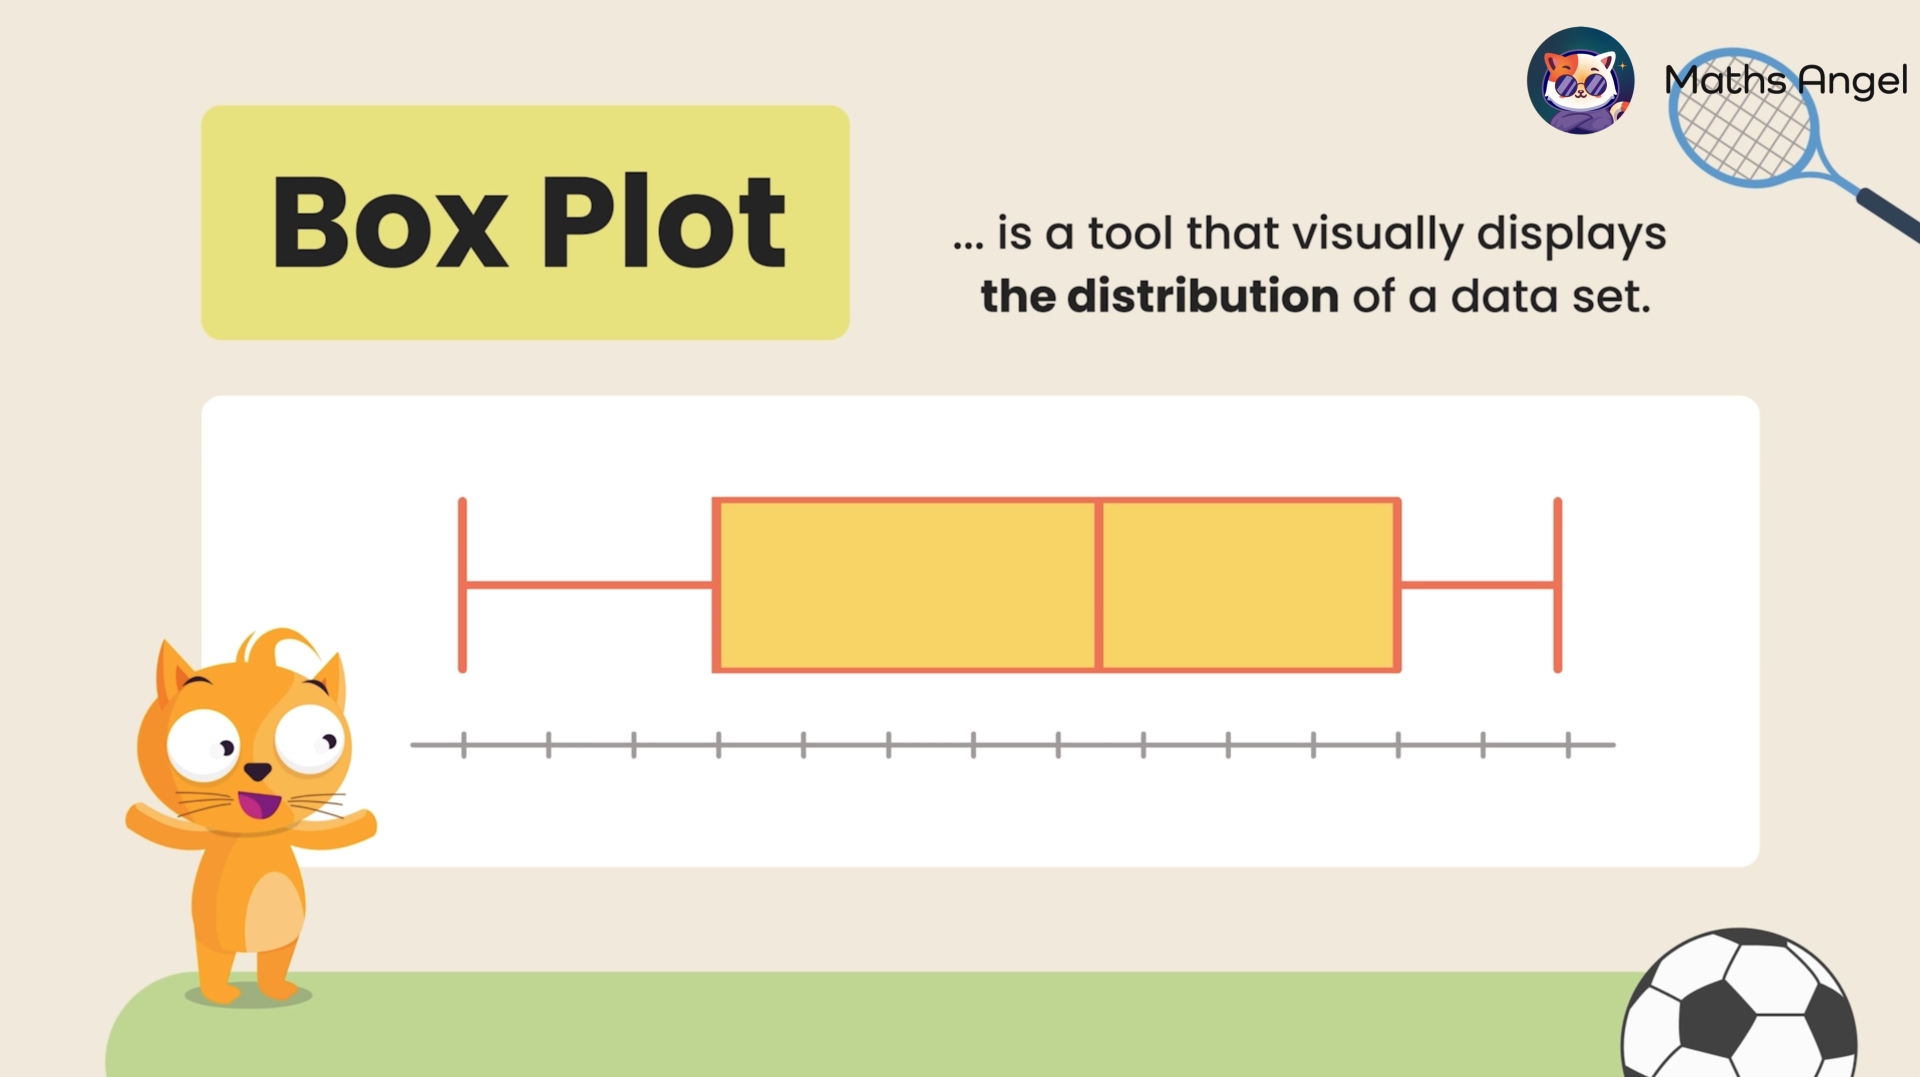
Box Plots
Video Tutorial
Key Aspects:
- Drawing and interpreting box plots
- Lower quartile (Q1), median, and upper quartile (Q3)
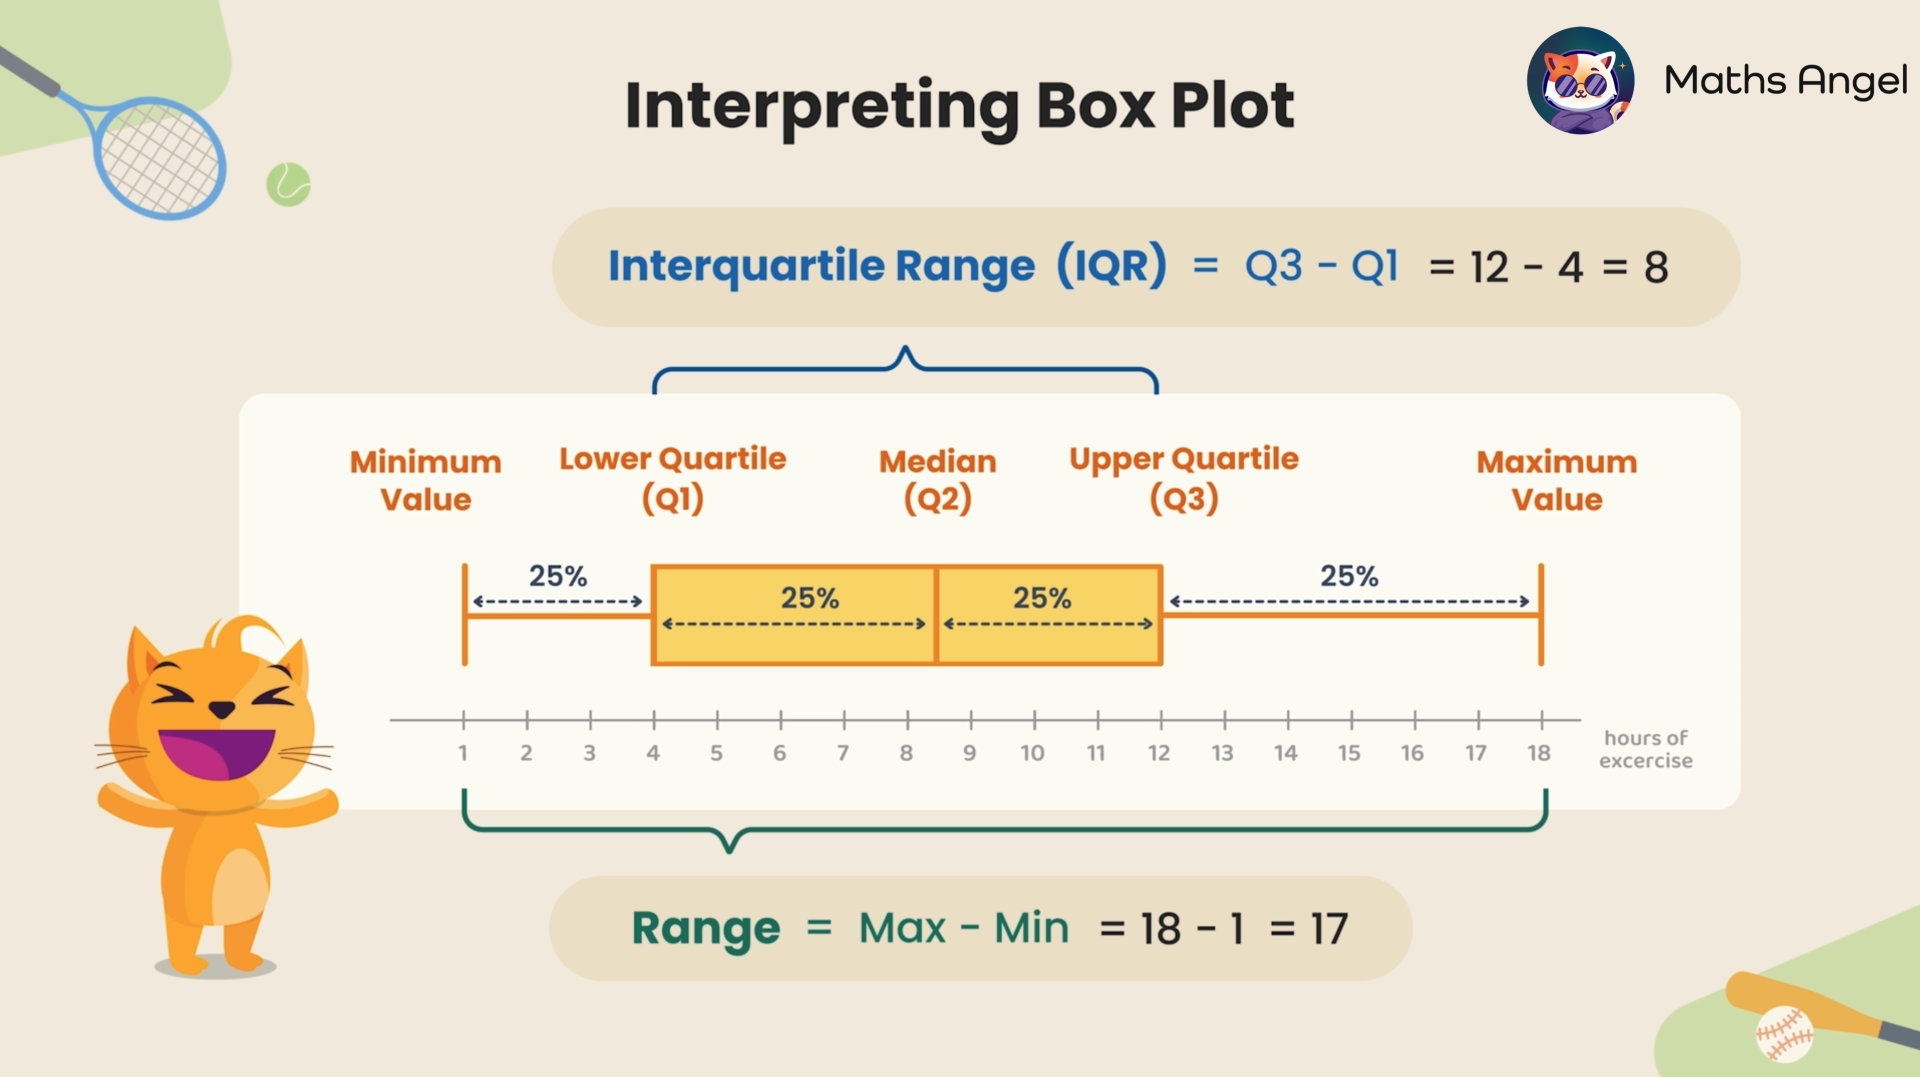
- Range and interquartile range (IQR)
- Analysing data spread and consistency using box plots
Write your awesome label here.
GCSE Revision Flashcards
1) Box Plots

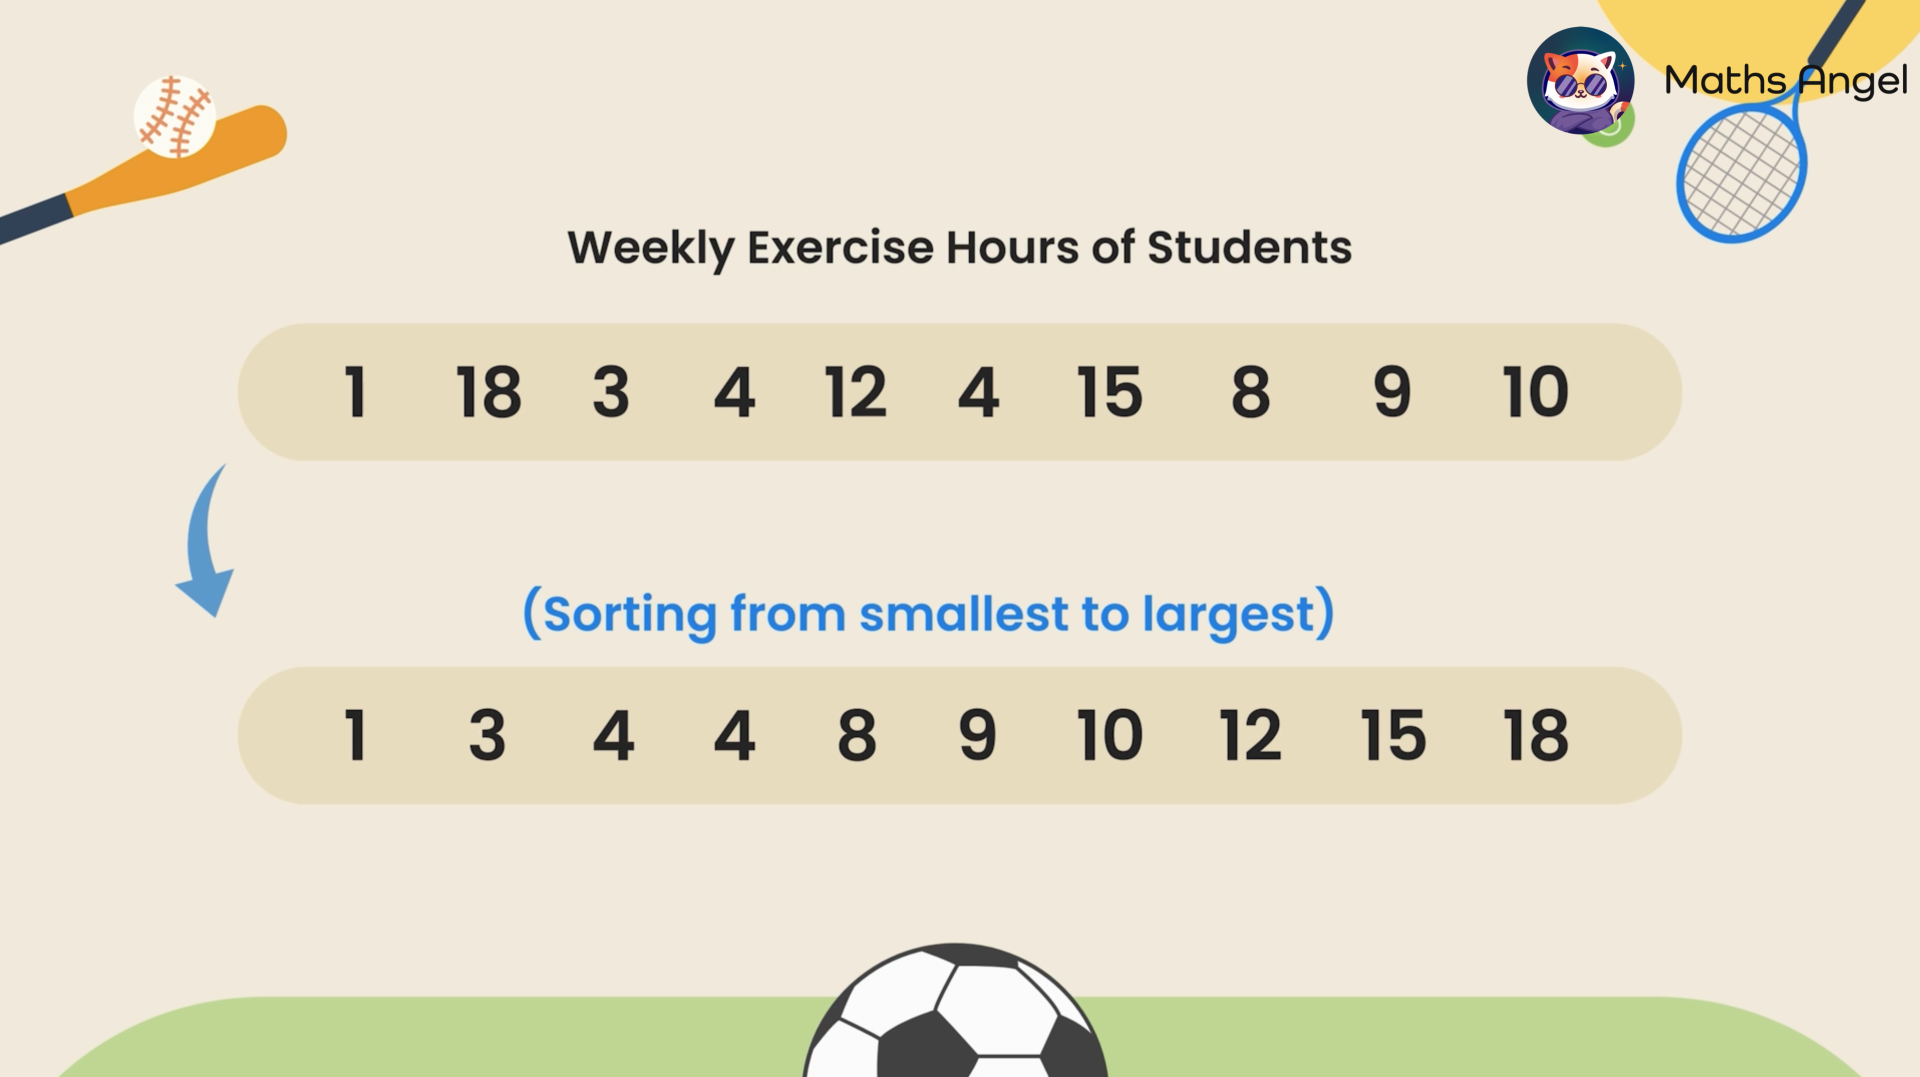
2) Drawing a Box Plot Step 1: Sort Values

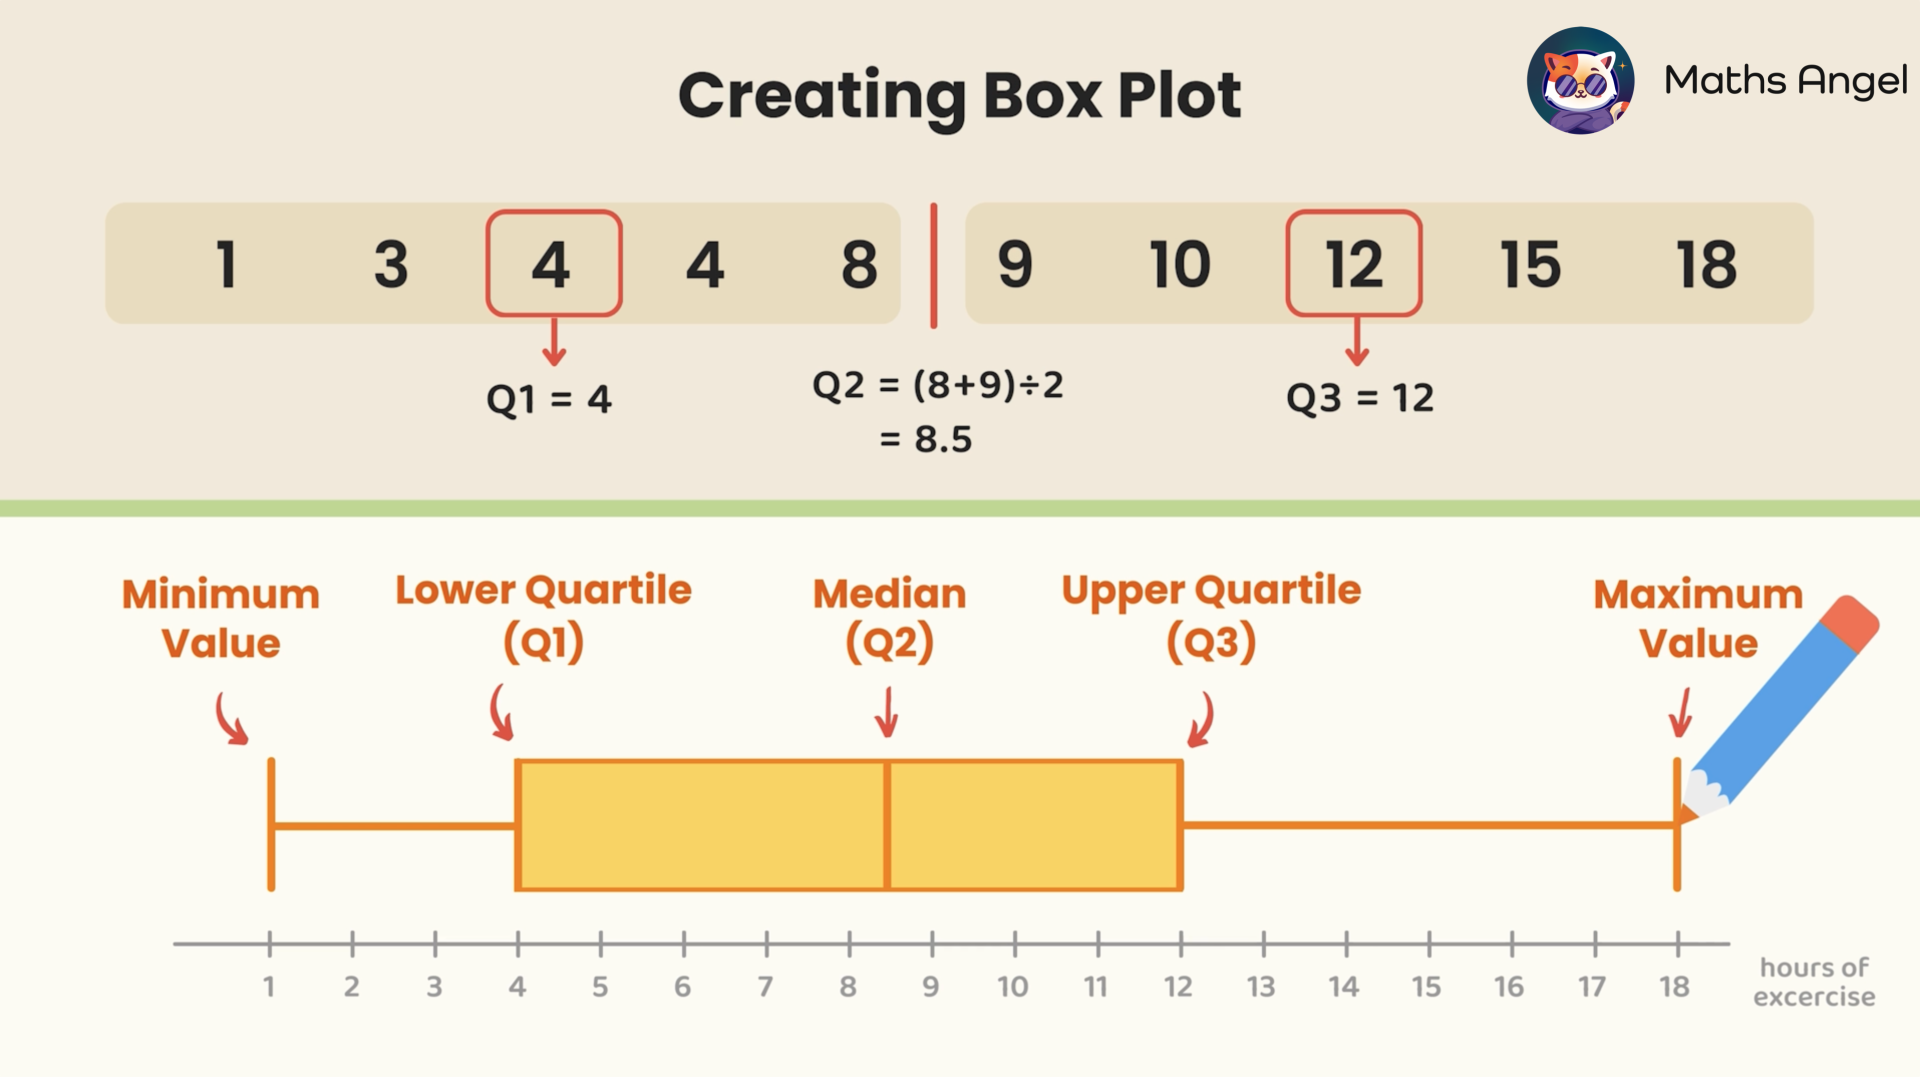
3) Drawing a Box Plot Step 2: Determine Min, Max and Quartiles

4) Interpreting the Box Plot

ChatCat - Your Personal AI Maths Tutor
Practice
(No payment details needed)
