Tally Mark Charts, Bar Charts, Tables
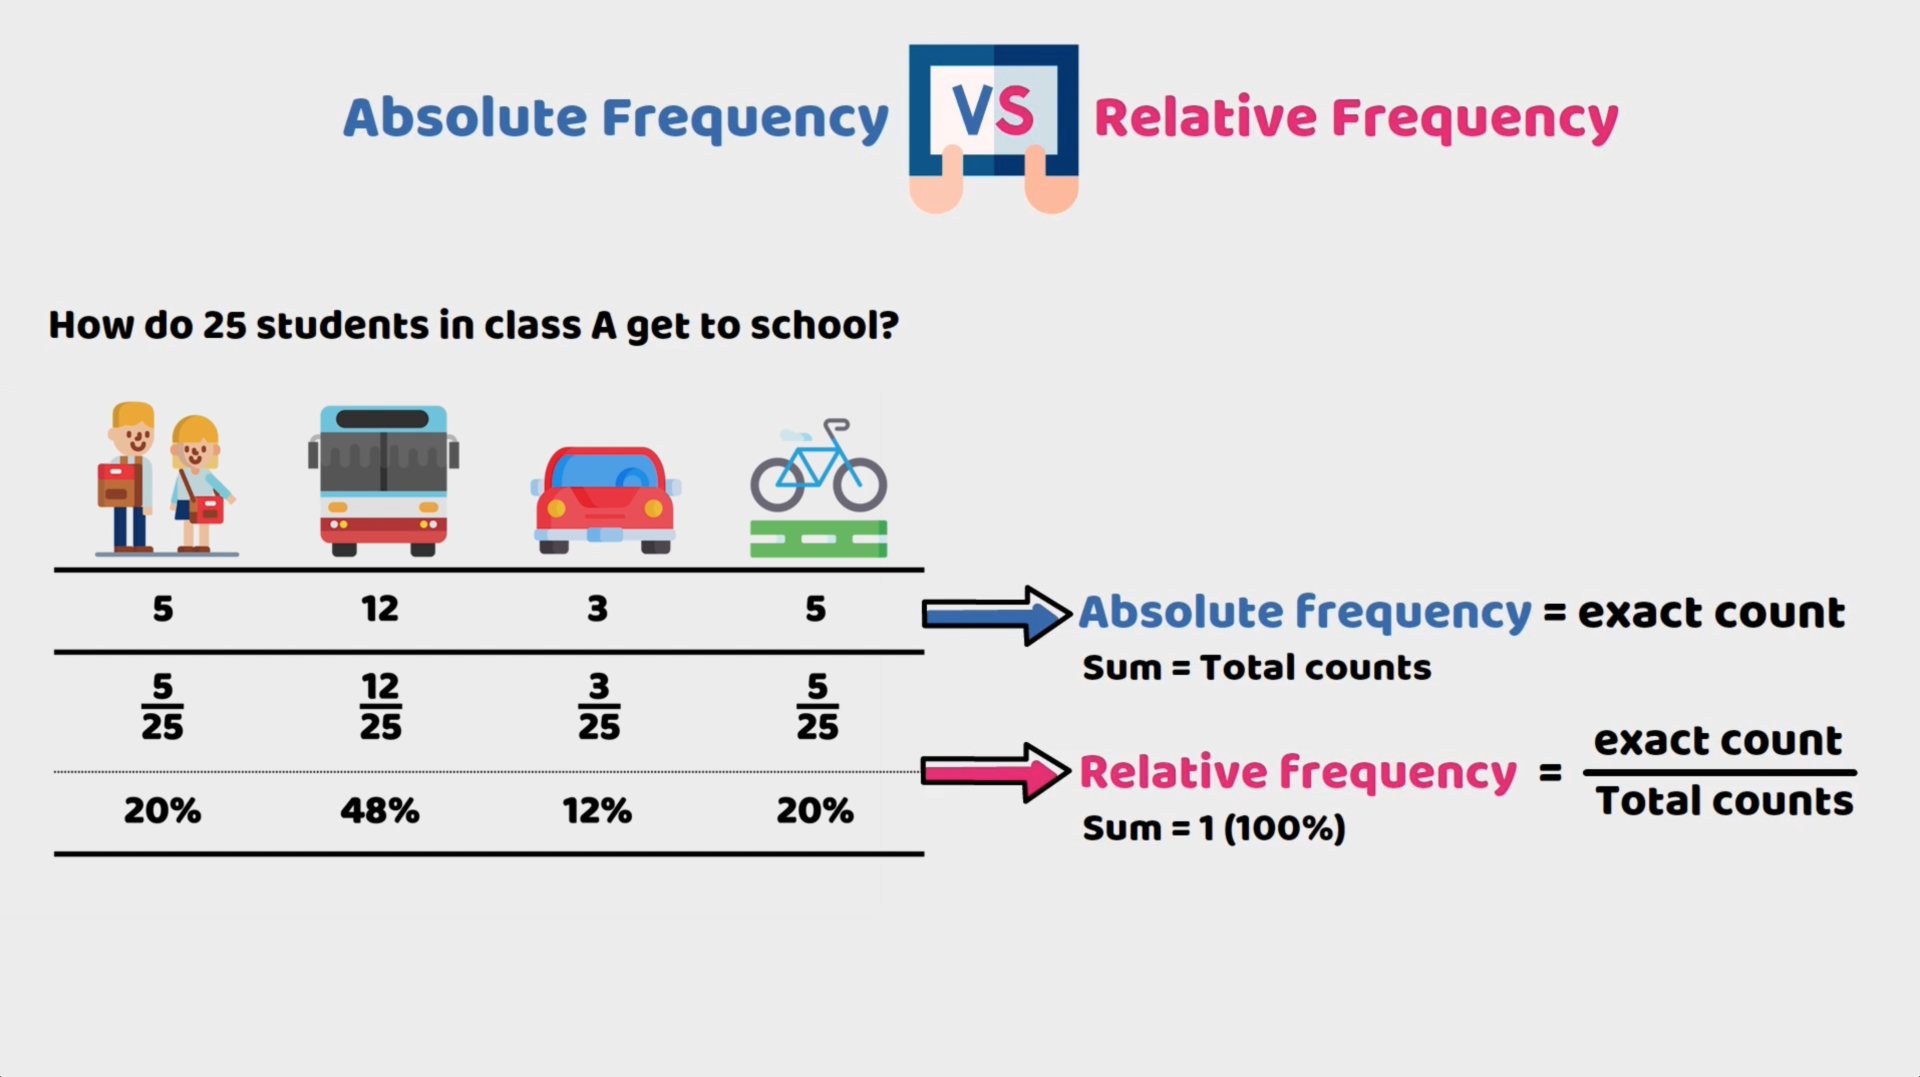
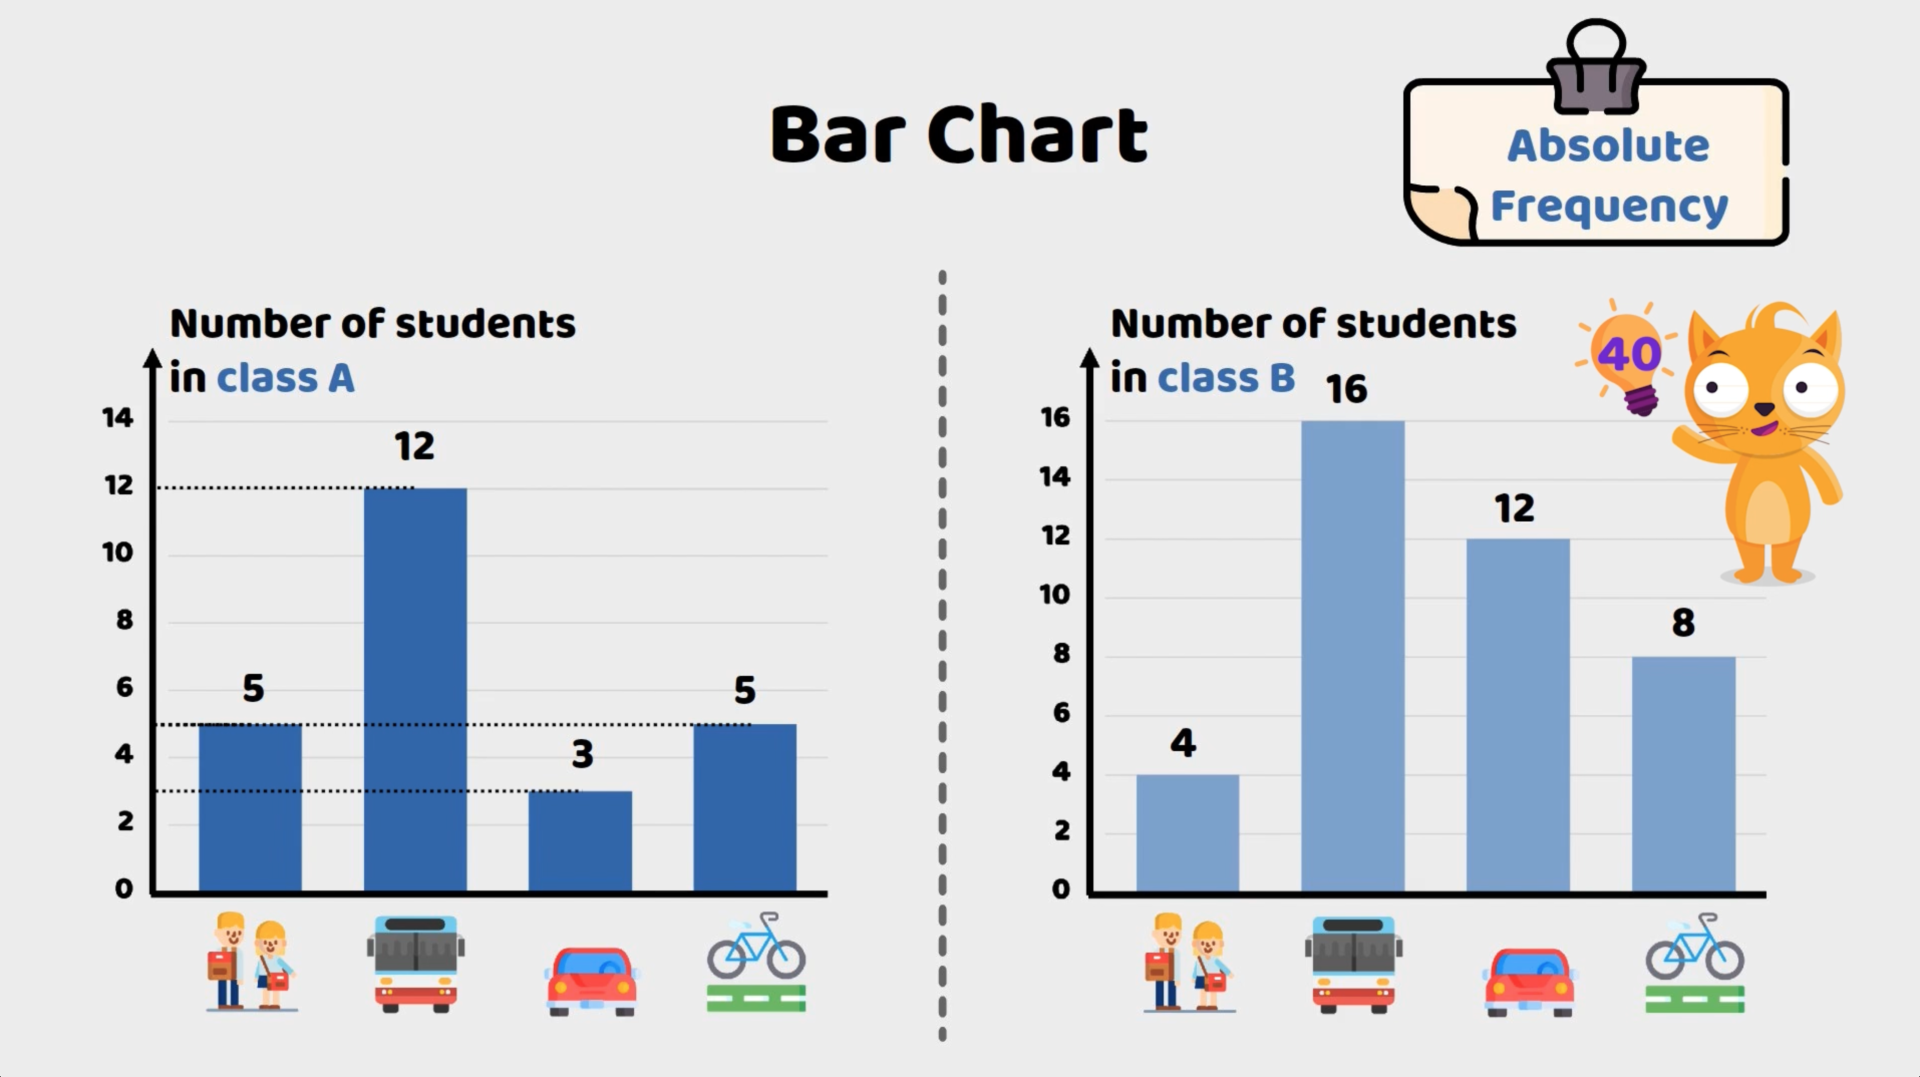
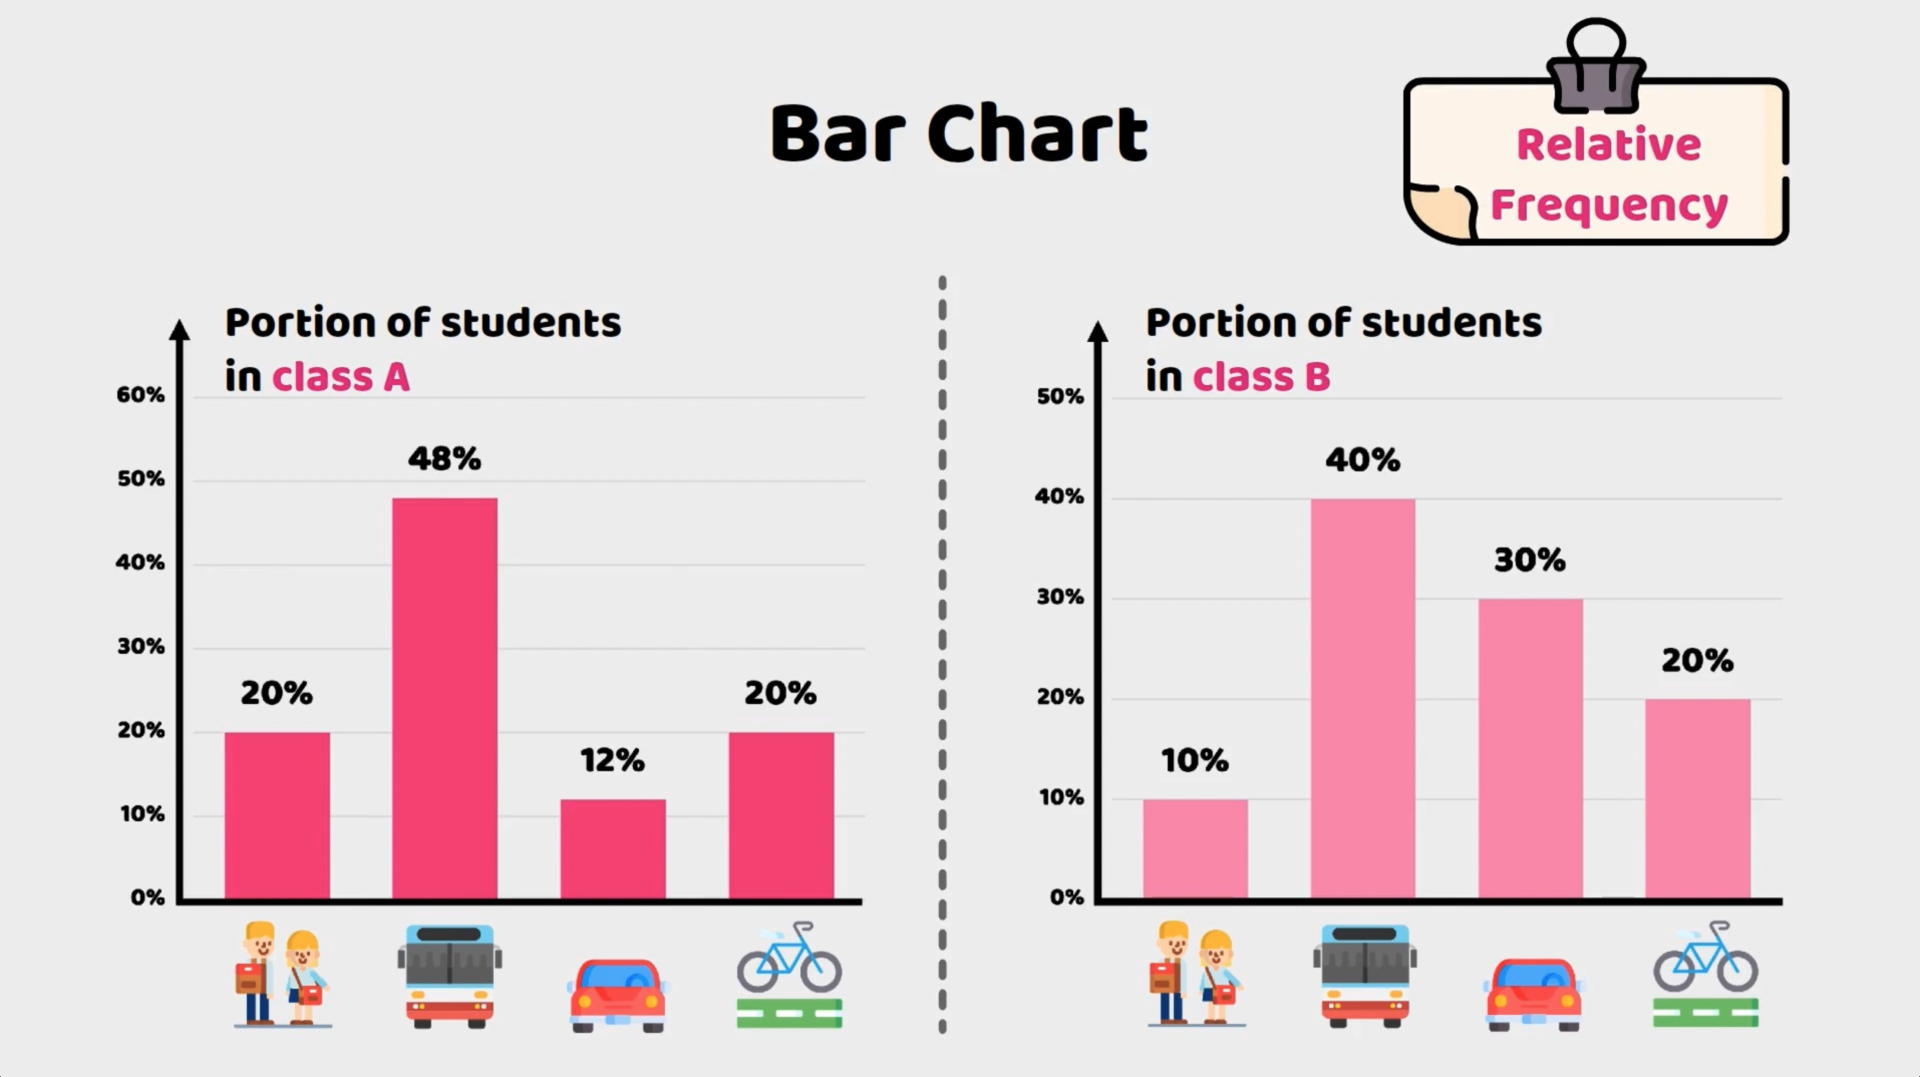
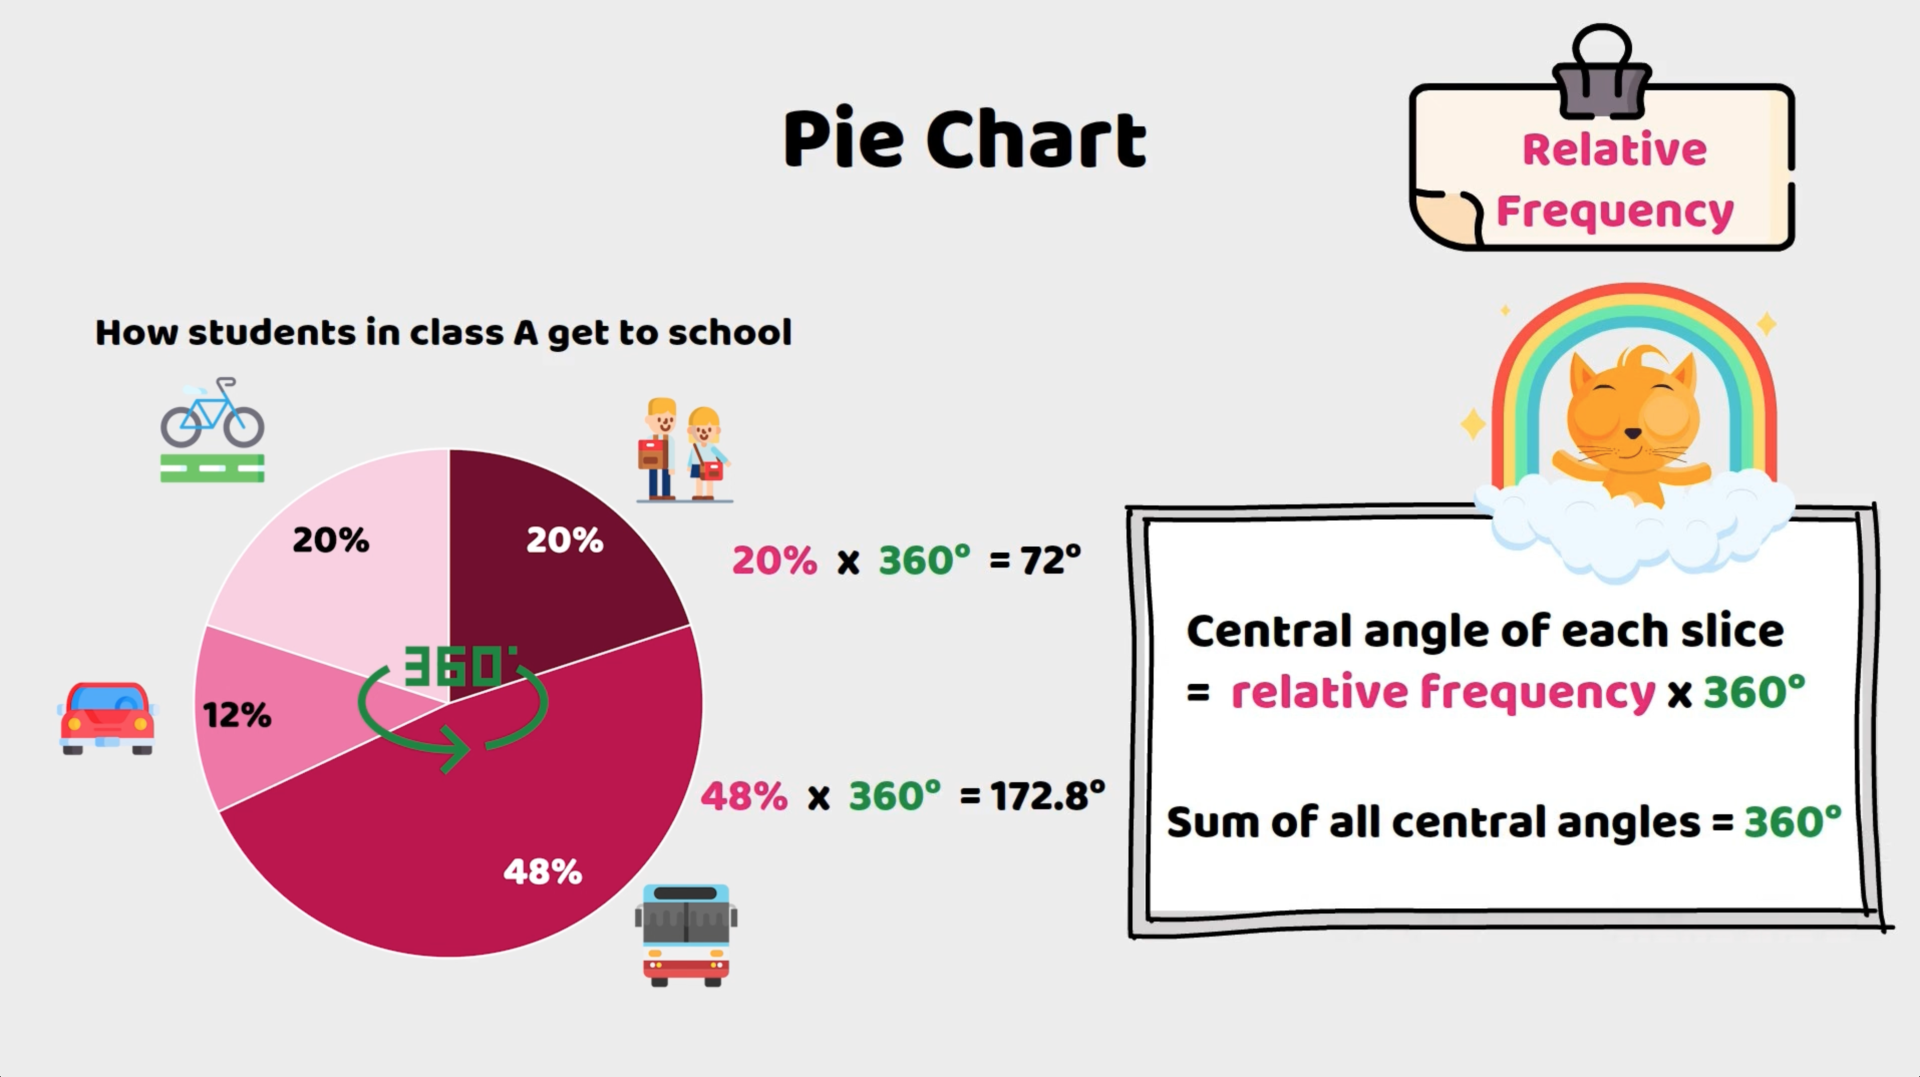
Absolute and Relative Frequencies
Median, Mean, Mode, Range
Median, Mean, Mode, Range from a Frequency Table
Box Plots
Grouped Frequency
Line Graphs and Curve Graphs
(No payment details needed)
Company
Contact Us
Mission
Our Blog
Legal
Privacy Policy
Terms of Use
Cookie Policy