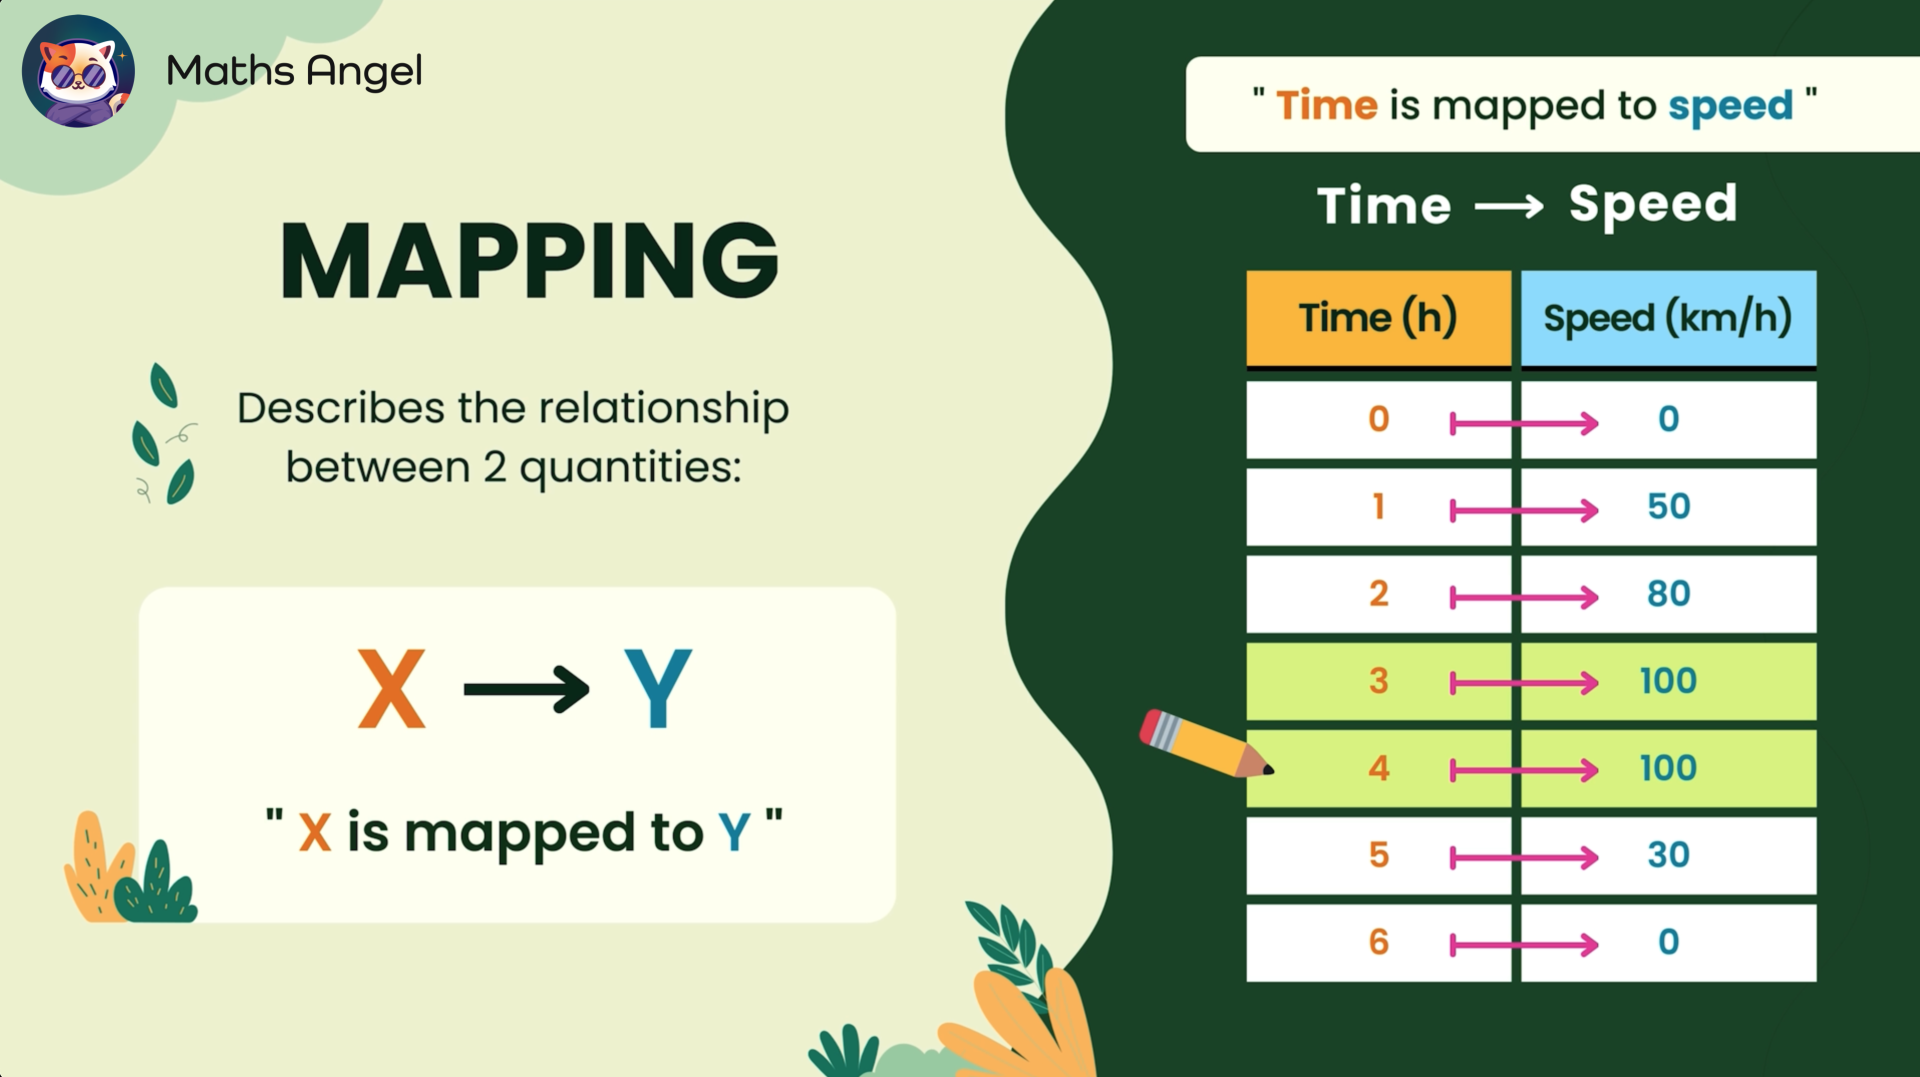
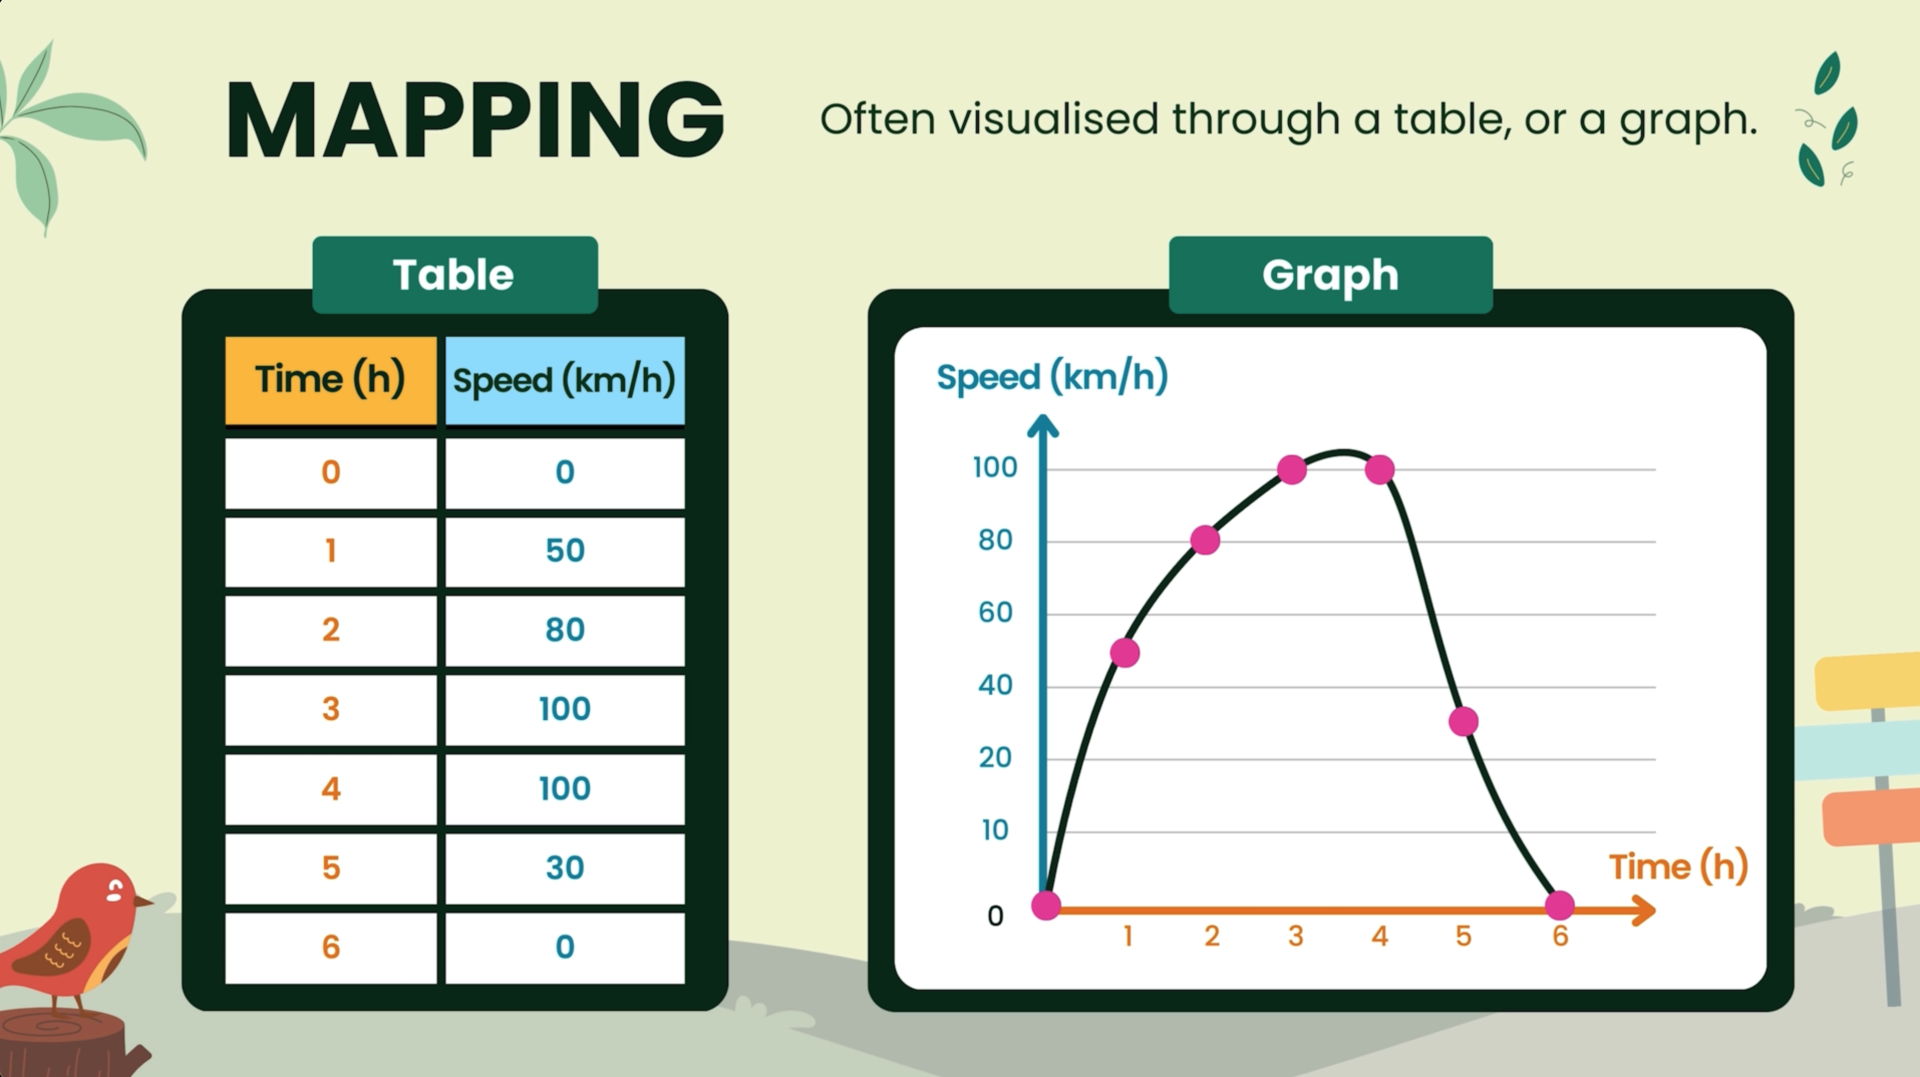
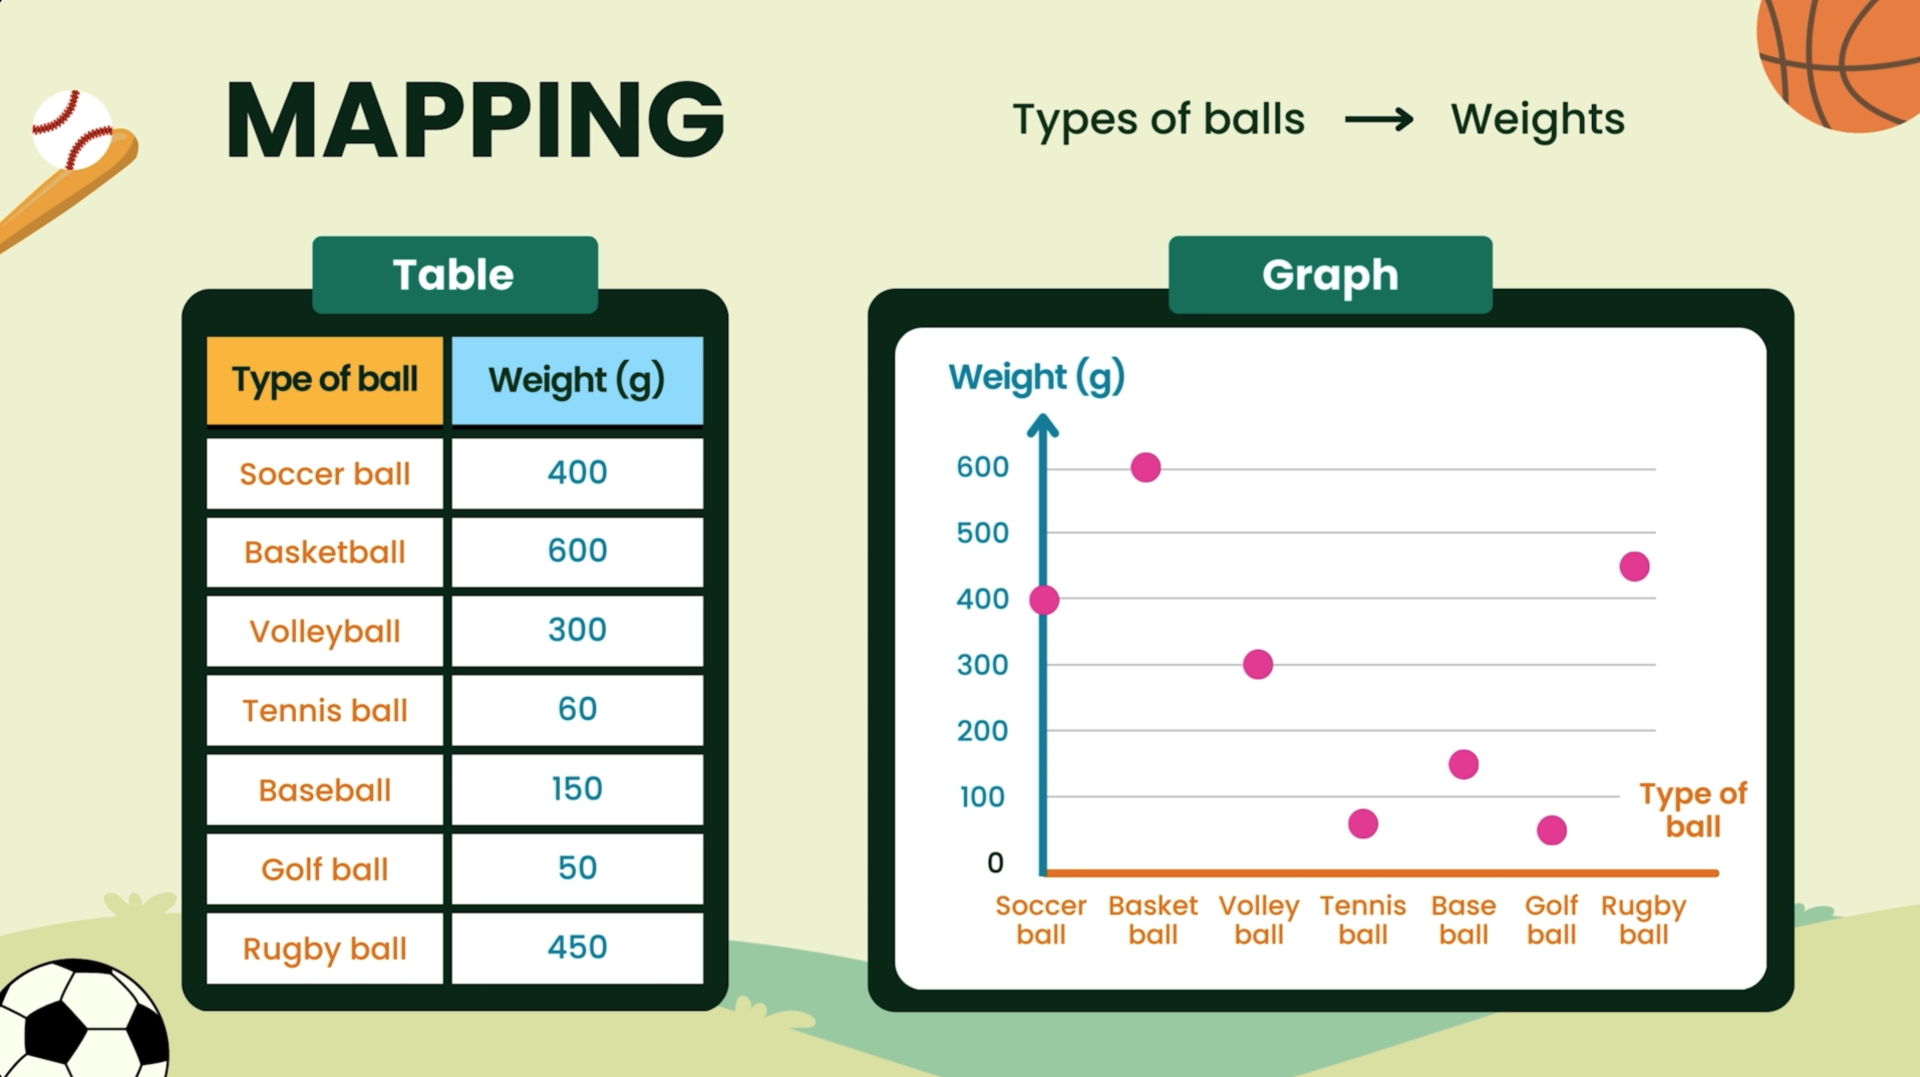
Introduction to Mappings

 Video Tutorial

Key Aspects:
  • Mapping Time to Speed
  • Visualising Mappings through Tables and Graphs
Write your awesome label here.

 Revision Cards

1) Time to Speed Mapping of a Car Trip

Mapping time to speed with a table showing time in hours and corresponding speed in km/h, illustrating the relationship between the two quantities.

2) Visualising Mappings through a Graph

Mapping of time and speed shown through a table and graph, with time in hours and speed in km/h.

3) Visualising Mappings through a Scatter Plot

Table and graph comparing the weights of different types of balls.

 ChatCat - Your Personal AI Maths Tutor

 Exercises

(No payment details needed)