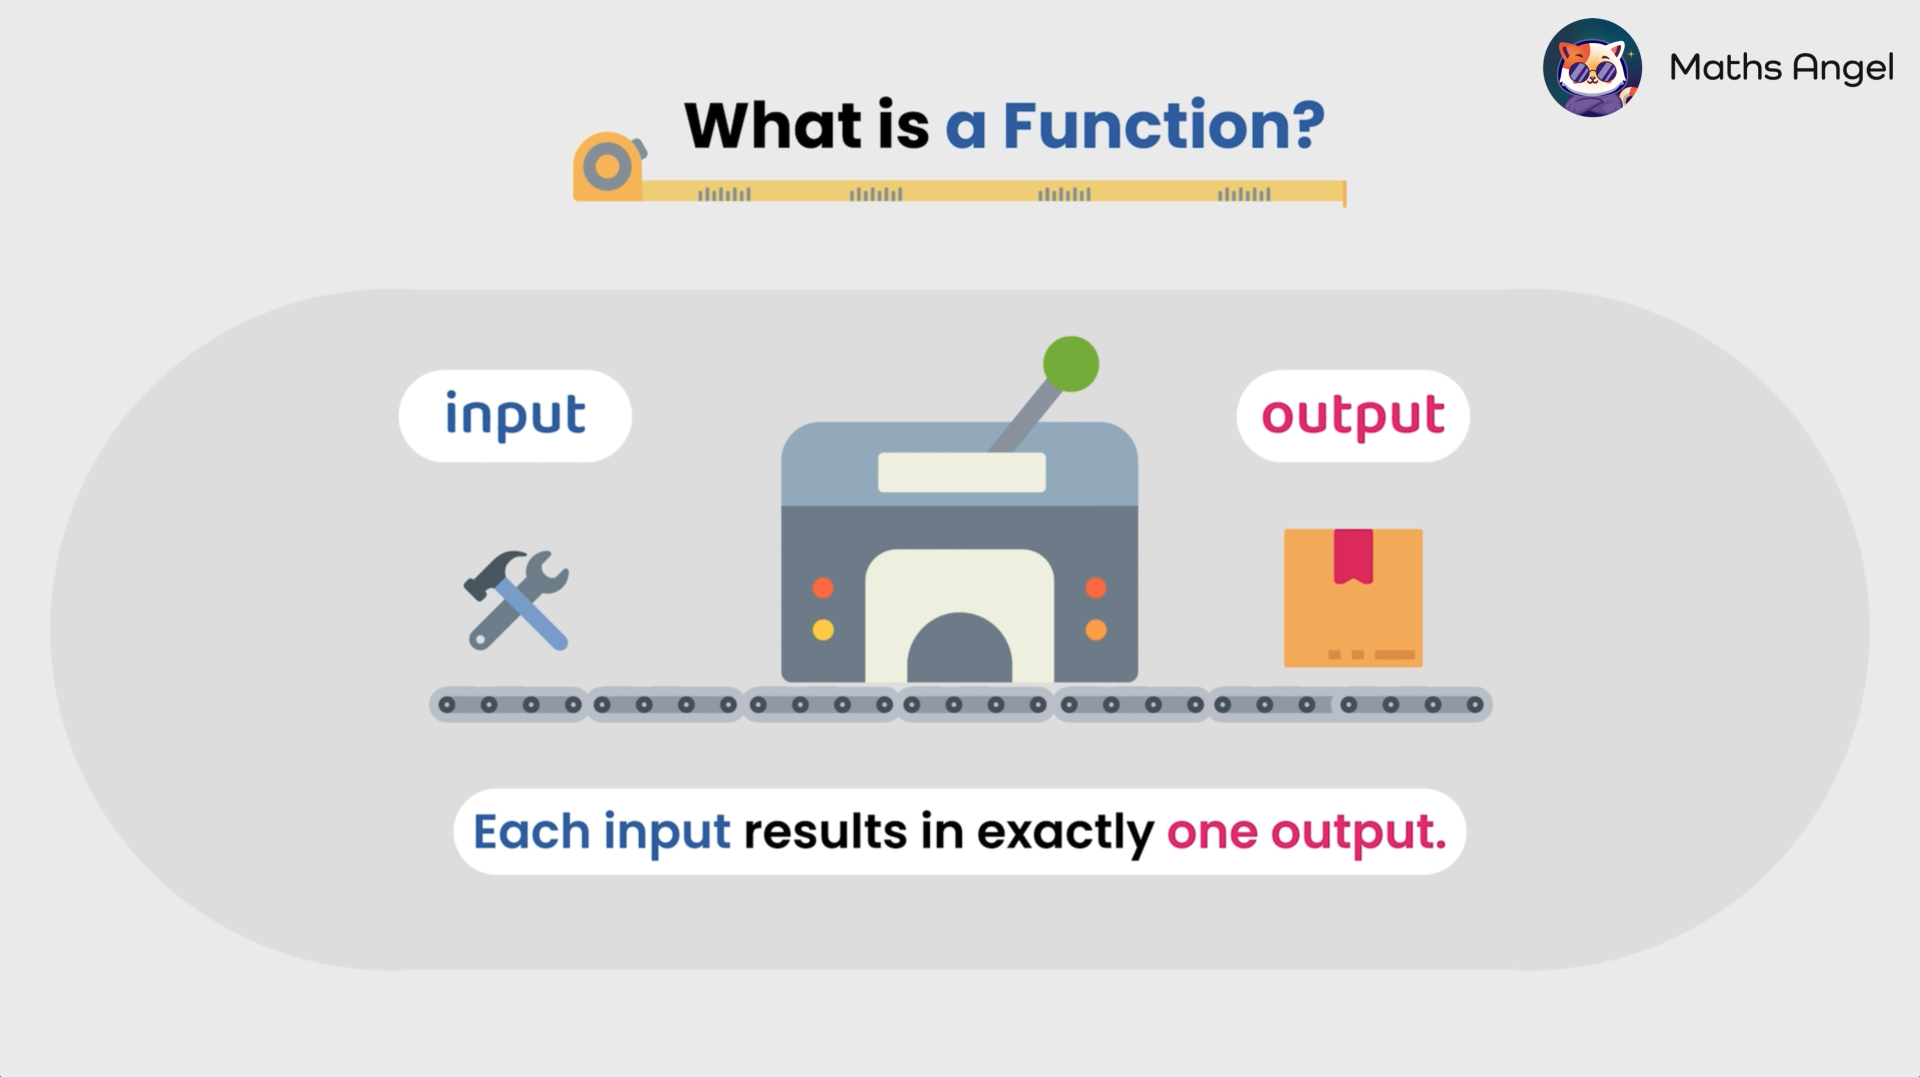
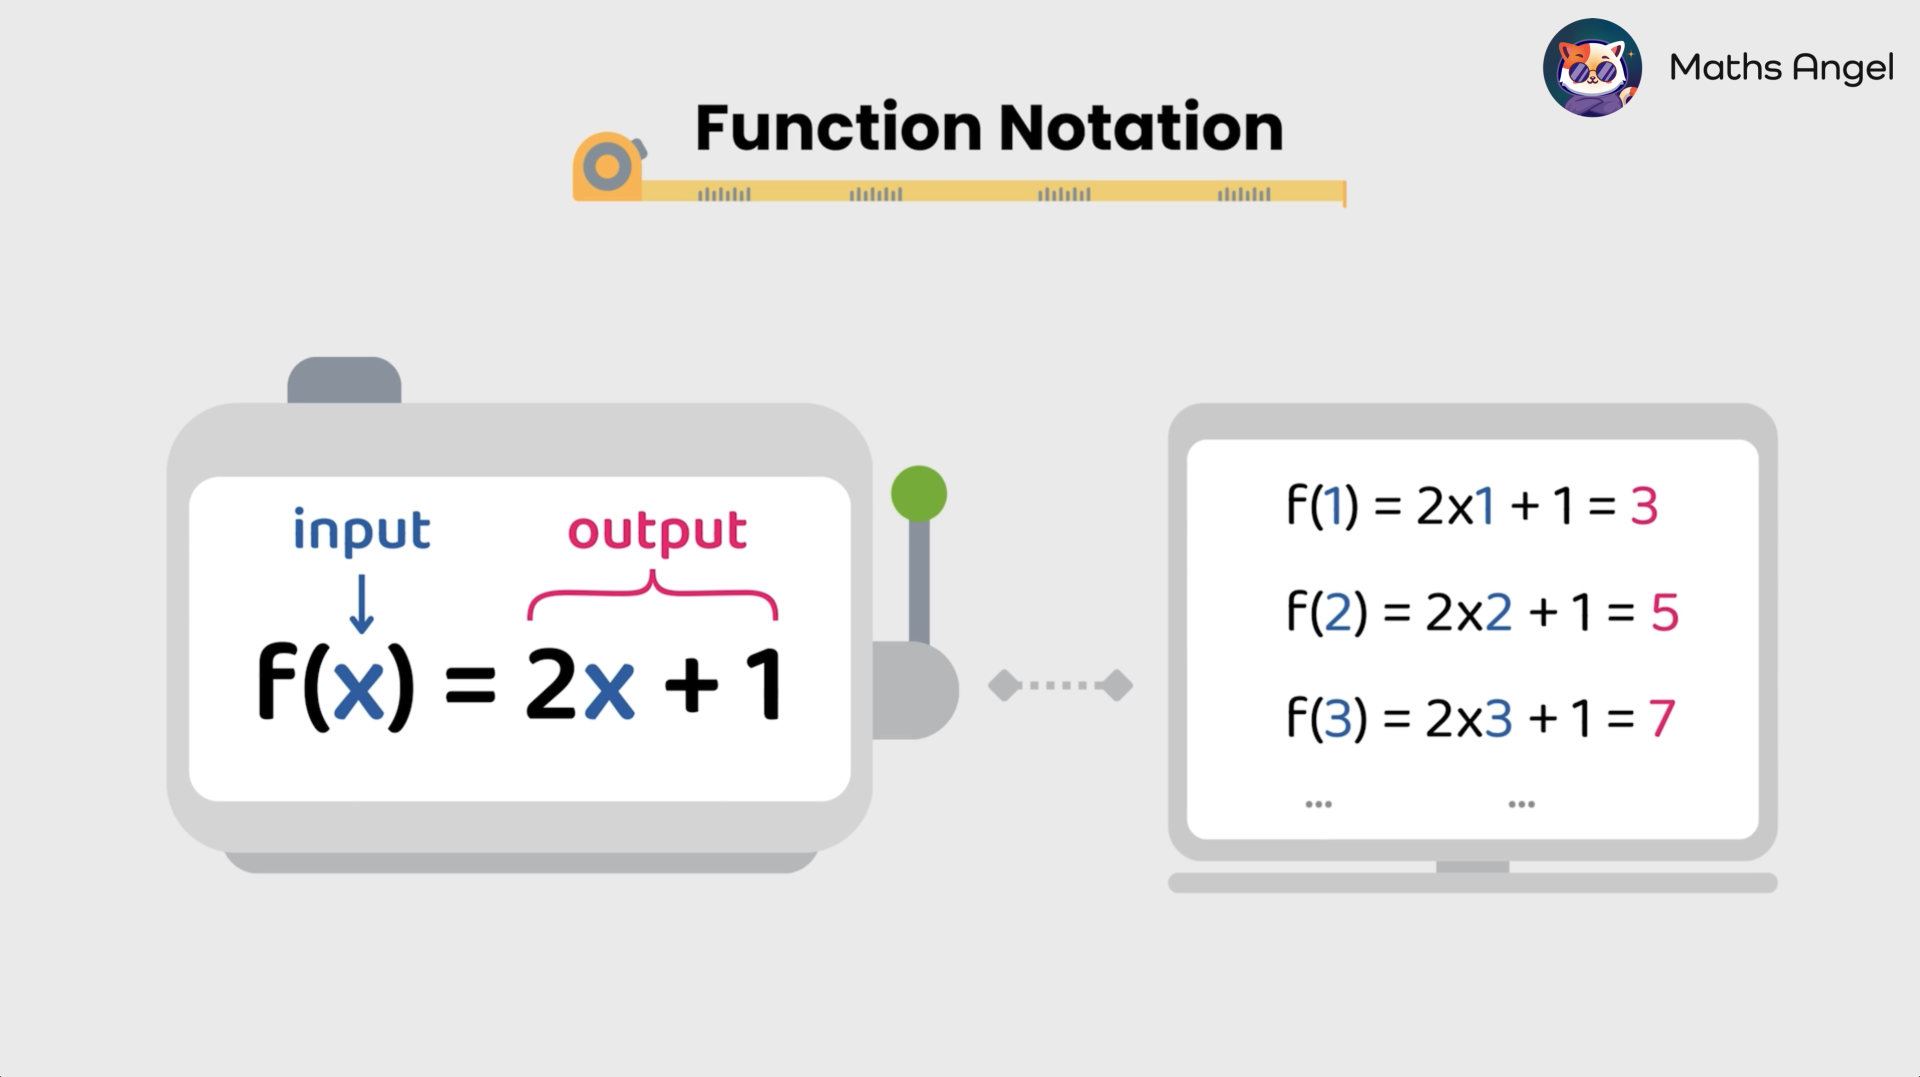
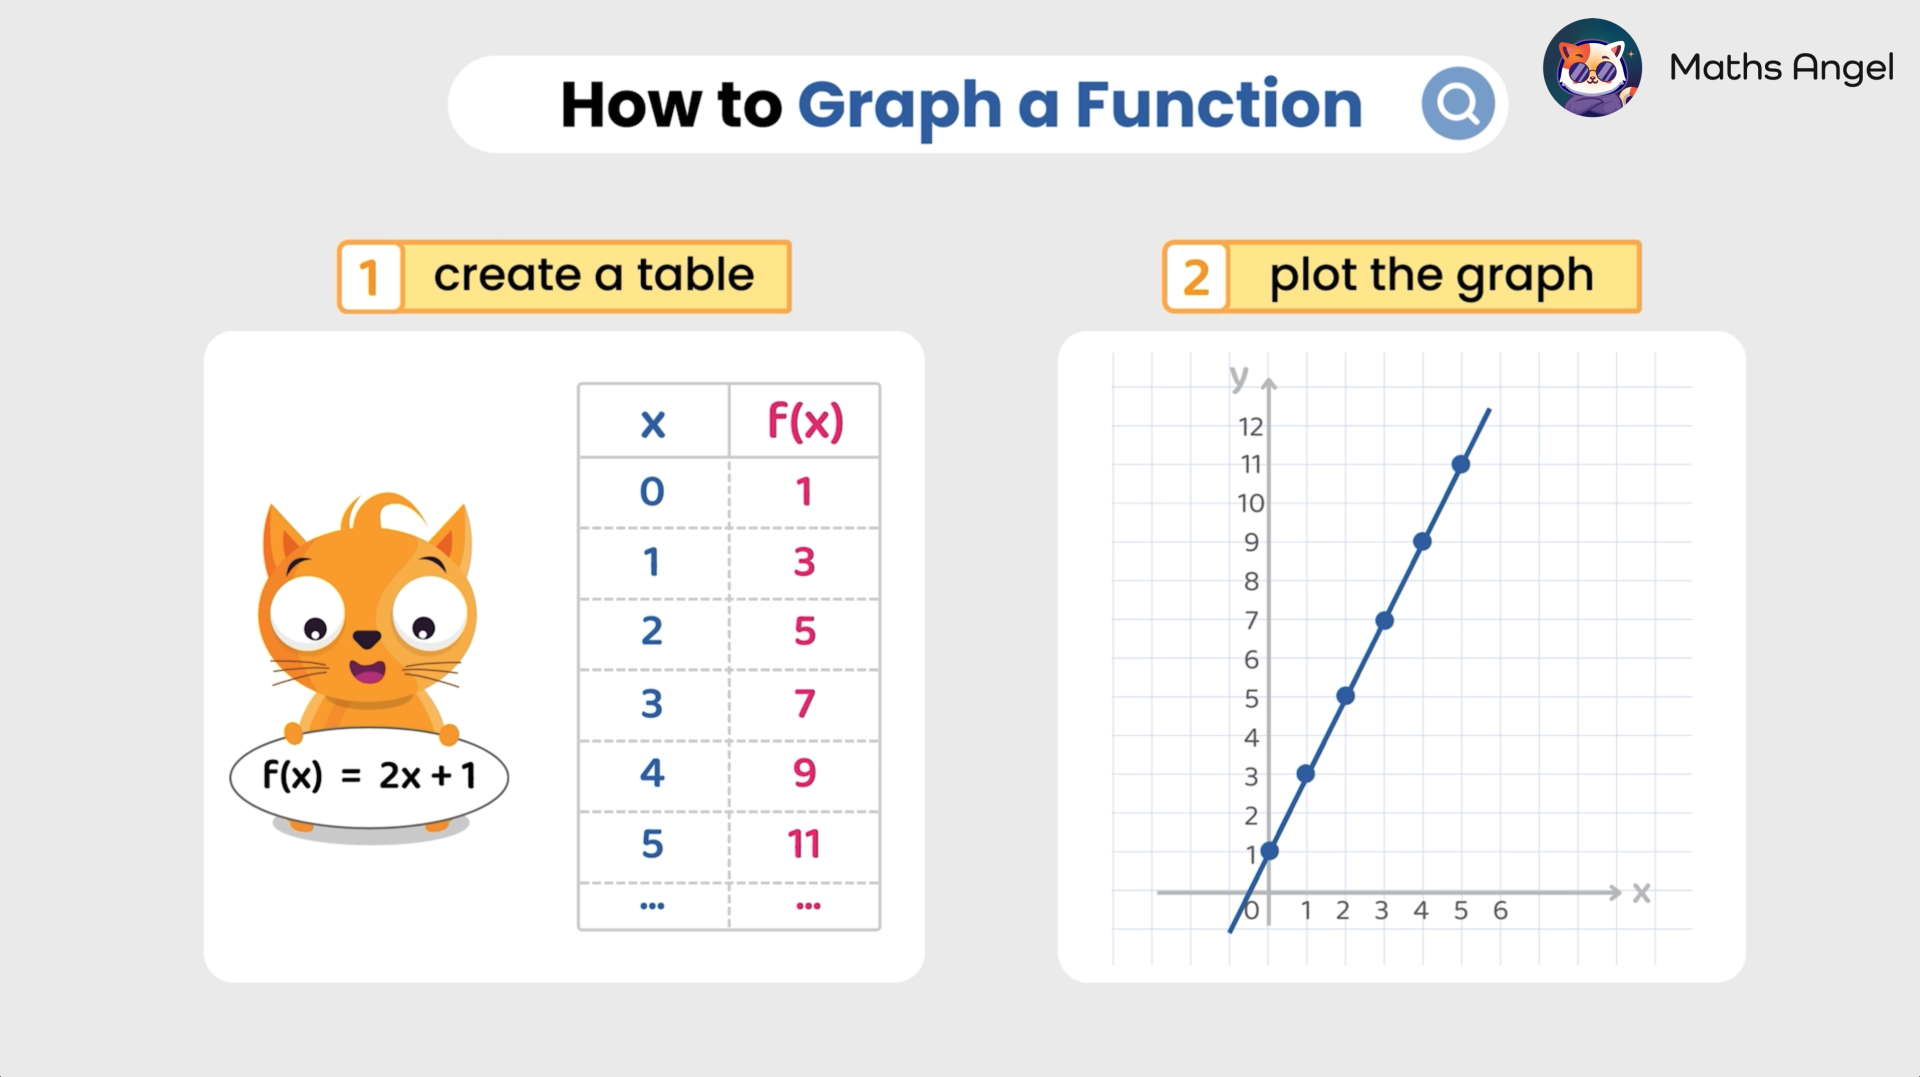
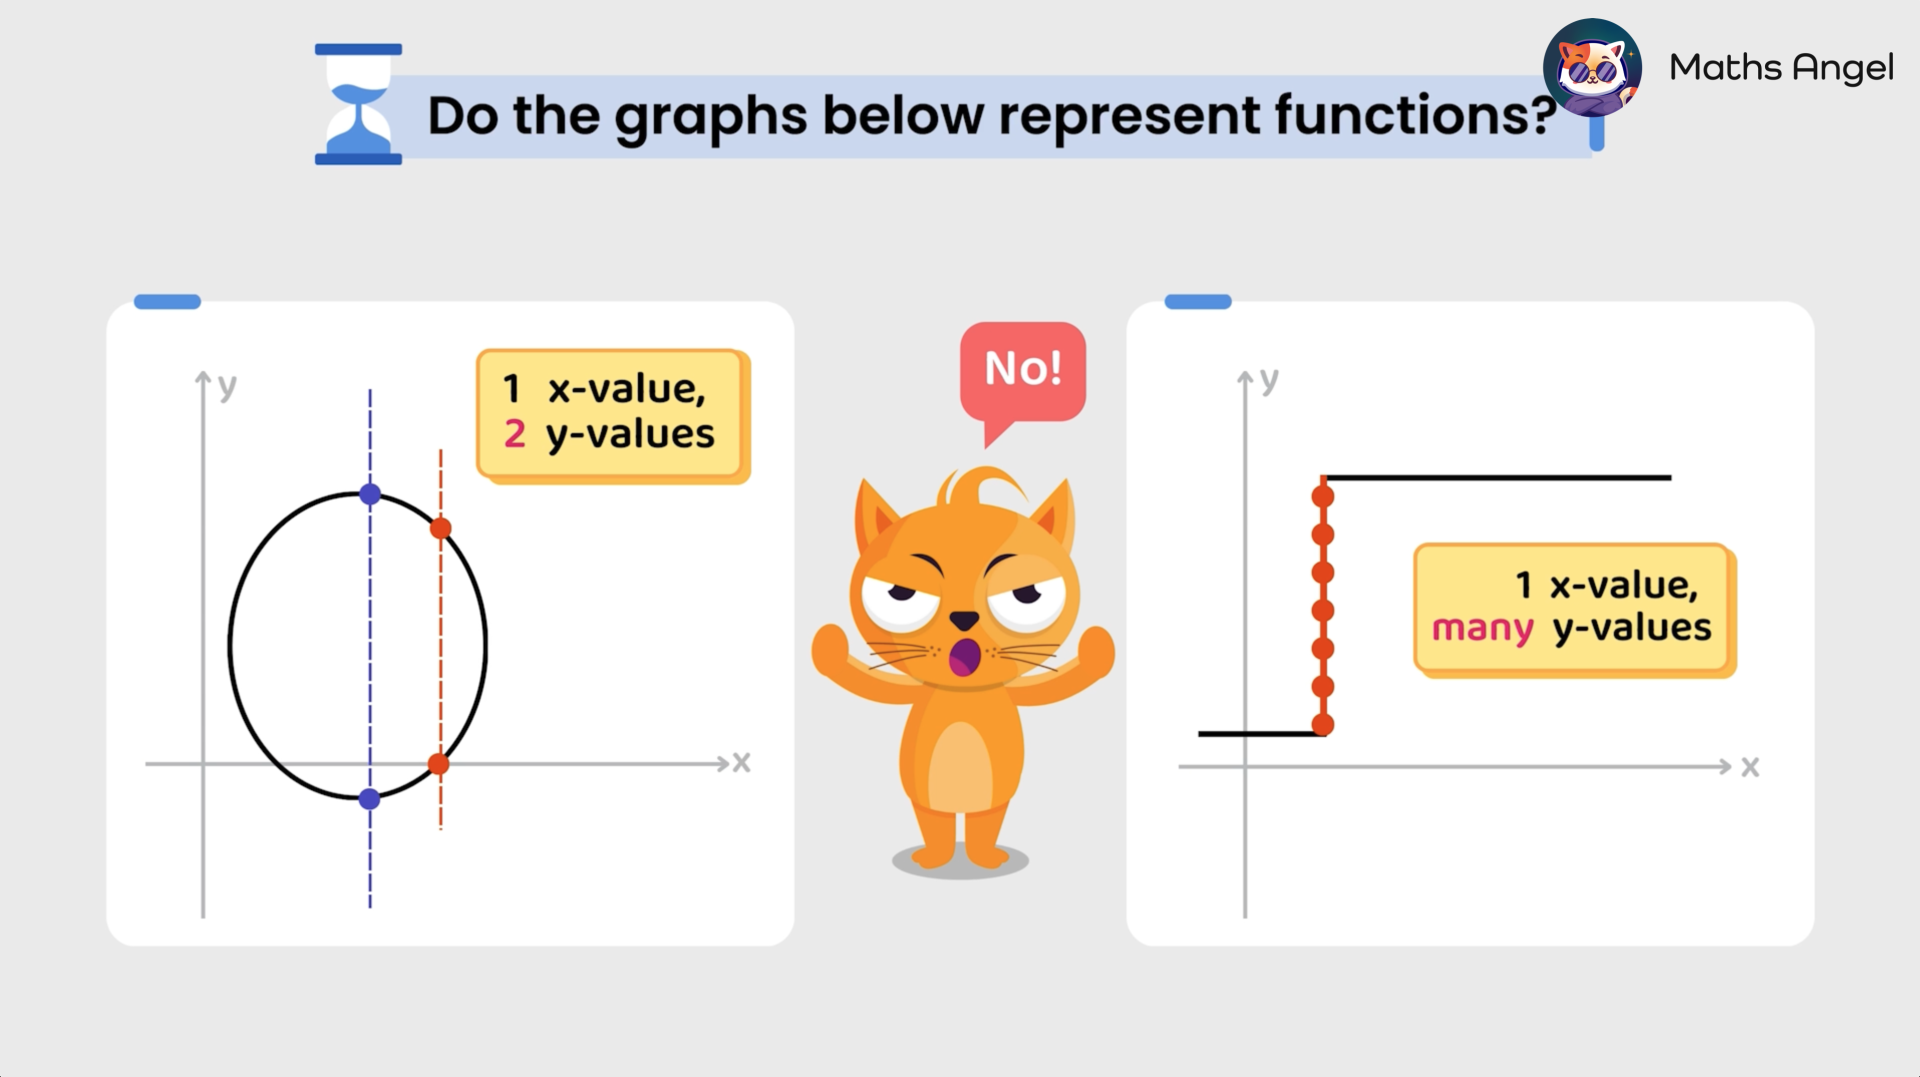
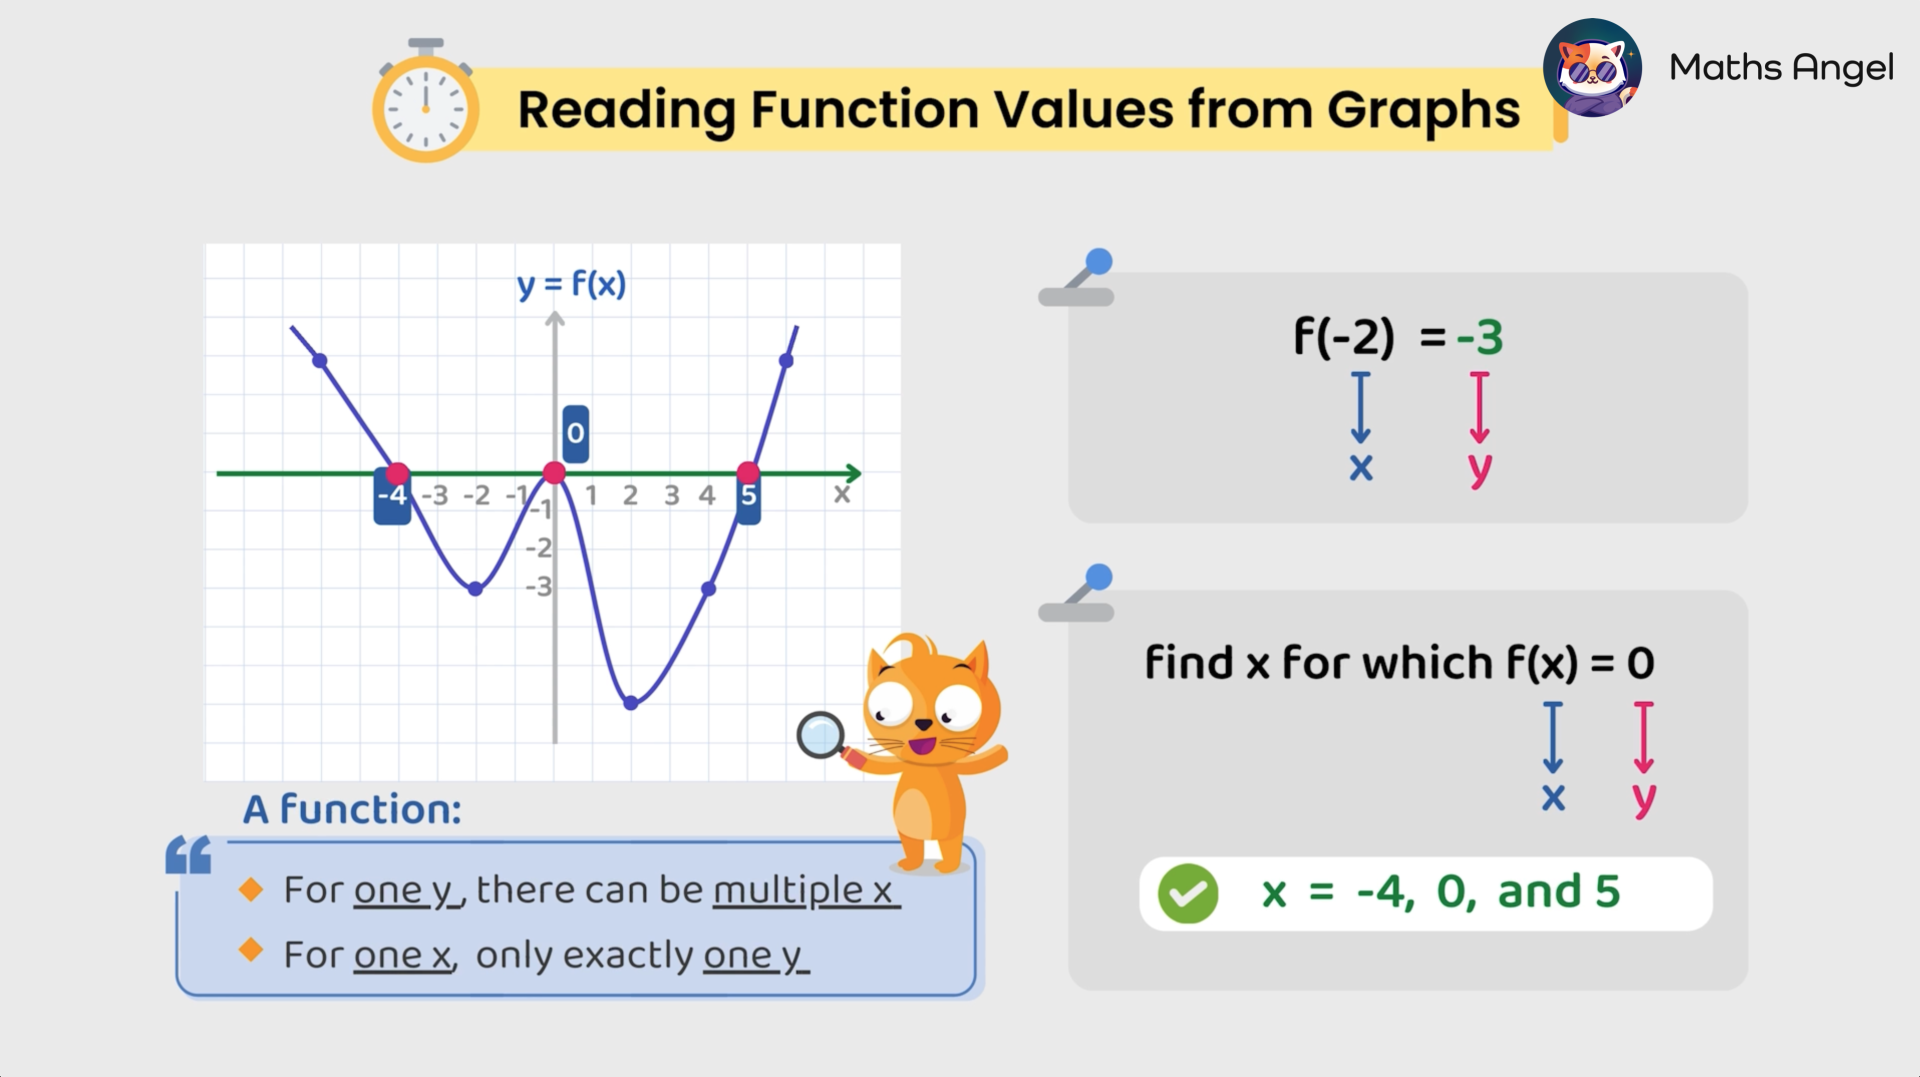
Introduction to Functions and Graphs

 Video Tutorial

Key Aspects:
  • What is a Function?
  • Function Notation
  • Plotting Graphs
  • Reading Values from Graphs
Write your awesome label here.

 Revision Cards

1) What is a Function?

Diagram explaining that a function transforms an "input" to one "output."

2) Function Notation

Visual representation of function notation showing the function f(x) = 2x + 1 and its calculated outputs for f(1), f(2), and f(3).

3) Plotting Graphs

Steps to graph a function showing a table of values for f(x)=2x+1 and its corresponding plotted graph with points.

4) Graphs Not Representing Functions

2 graphs showing non-functions: one with a circle and another with a vertical line, explaining that one x-value must not have multiple y-values.

5) Reading Function Values from Graphs

Graph showing function values with examples: f(-2) = -3 and f(x) = 0 at x = -4, 0, 5, with a function definition.

 ChatCat - Your Personal AI Maths Tutor

 Exercises

(No payment details needed)